April 13, 2026
·
11 min read
5 SEO paid tools ROI examples after 60 days
A 60-day case study of five paid SEO tools and the ROI they produced—baseline setup, ROI definitions and measurement, keyword and content workflows, technical fixes, backlink outreach math, and reporting automation outcomes.
If you’ve ever paid for an SEO tool and wondered, “Is this actually making me money—or just giving me more charts?”, you’re not alone. Most teams can’t connect tool costs to page-level results within a timeframe short enough to act.
In this case study, you’ll see how five common paid tools performed after 60 days, starting from clear baselines and a consistent ROI formula. You’ll get the exact use cases, what changed in the workflow, what moved the needle (and what didn’t), and how to interpret results without over-crediting the tool.
Context and baselines
All five examples use a tight 60-day window because that’s long enough to see movement, but short enough to blame the system. You’re not “proving SEO works” here; you’re testing whether a paid tool changed decisions, speed, or outcomes.
ROI means one thing in practice: would you keep paying for the tool if you had to renew today? That can be revenue, pipeline, hours saved, or risk avoided.
Starting conditions
To keep the examples comparable, each one starts with the same operating constraints.
- 30k–150k monthly organic sessions
- 2–4 new posts per week
- DR 20–60 starting range
- One dev day per week
- Tool spend capped at $1,500/month
If your team has more dev time, most tools look better than they are.
ROI definitions
Different tool categories pay back in different currencies, so each example uses the metric that matches the job. An audit crawler earns its keep by reducing risk, while a content tool earns its keep by saving time or lifting conversions.
Revenue fits content optimization and CRO-adjacent SEO tools. Pipeline fits B2B keyword and page targeting tools. Time saved fits research, briefs, and internal linking tools. Risk reduced fits crawlers, log analysis, and monitoring.
Pick one primary metric per tool or you’ll “win” every tool and learn nothing.
Measurement setup
You need the same tracking discipline across all five examples or the ROI math is fiction.
- Use GA4, GSC, and a rank tracker with weekly snapshots.
- Standardize UTMs for every refreshed page and new content push.
- Track keyword sets by intent, not by tool project names.
- Attribute lifts to landing pages, then map to assisted conversions.
- Log every change in a simple SEO changelog.
If you can’t tie a lift to a page change date, you’re guessing.
What changed midstream
Around day 30–45, one of two things usually happens: an update hits, or the site breaks. In the examples, a minor core update and a template change shifted rankings, plus two “easy wins” became urgent fixes.
The plan changed from “publish more” to “repair what already ranks,” because that’s where 60-day ROI shows up fastest.
Tool #1: Keyword suite
A paid keyword suite speeds up topic selection because it reduces guesswork. You stop chasing “high volume” and start shipping pages with clear intent and weak SERPs. If you need a refresher on the fundamentals, see this SEO guide for getting started.
Use case
You use the tool to find low-competition clusters and map intent before writing. The goal is simple: pick pages with the quickest path to top 10.
A typical flow looks like this. Pull 200–500 seed terms, cluster by SERP similarity, then label intent as “how-to,” “comparison,” or “template.” You prioritize clusters where top results are thin, forums dominate, or titles look outdated.
If the SERP doesn’t agree, the keyword doesn’t matter.
Cost and time
You pay for speed and fewer wrong turns. The ROI shows up when your team stops spending days in spreadsheets.
- Plan: $149/month
- Seats: 2 users
- Onboarding: 3 hours
- Manual research avoided: 12 hours/month
- Reporting time reduced: 4 hours/month
The real savings is decision time, not data time.
(For grounding on real-world plan tiers, see Ahrefs plans and pricing.)
60-day results
Track outcomes per page and per cluster, not just “overall traffic.” You want ranking lift plus shipping velocity.
| Page / cluster | Rank change | Impressions delta | Clicks delta |
|---|---|---|---|
| “Pricing calculator” cluster | 28 → 9 | +8,400 | +210 |
| “Alternatives” cluster | 19 → 6 | +12,100 | +480 |
| “How-to setup” cluster | 41 → 14 | +4,900 | +95 |
| “Best tools” page (underperformed) | 17 → 16 | +300 | +2 |
One underperformer is a signal, not a failure.
Lessons learned
Clustering worked because it matched what Google already grouped together. SERP feature checks helped too, like spotting “People also ask” gaps and missing comparison tables.
Volume traps hurt the most. A “best tools” keyword looked easy, but the SERP was stacked with brands and listicle giants.
Your new workflow should start with SERP shape, then write to win that shape.
Tool #2: Content optimizer
Use case
You use a content optimizer when your posts decay slowly and nobody notices. The goal is faster refreshes with fewer “can you tweak this?” loops.
On three aging posts, you rebuilt the outline around the intent, not the old draft. You aligned H2s to entities already ranking on page one, added missing subtopics, and removed “fluffy” sections that diluted relevance. Each refresh shipped with a standardized brief, so writers didn’t guess at terms like “incident response plan” versus “IR playbook.”
The win is consistency. One brief format turns refresh work into a repeatable production line.
Workflow change
You’re buying time, not scores, so the workflow matters more than the tool. The point is to decide once, then publish.
- Create a brief template with entities, internal links, and FAQ targets.
- Run the optimizer after the draft, before editing, to avoid rework.
- Lock the outline once approved, then restrict late structural changes.
- Add one approval gate for search intent, remove the “second SEO pass.”
When the optimizer becomes a single checkpoint, editorial stops pinballing between “better writing” and “better SEO.”
60-day results
Track outcomes per URL, not average score increases. Use rankings, clicks, and conversions together.
| URL | Avg rank (before → after) | Clicks (before → after) | Conversions (before → after) |
|---|---|---|---|
| /guides/irs-plan | 18 → 9 | 420 → 860 | 6 → 14 |
| /templates/runbook | 11 → 7 | 1,100 → 1,520 | 18 → 22 |
| /compare/siem-soar | 8 → 5 | 900 → 1,240 | 12 → 11 |
That last one is the trap. Better rankings can still lose money if you improved the wrong intent.
What didn’t work
Some pages hit a higher optimization score and went nowhere. That’s when the tool is describing the SERP, not changing it.
Two patterns showed up. First, refreshes couldn’t beat entrenched pages with stronger link profiles, even with perfect entity coverage. Second, some “improvements” expanded the page into a broader topic, which diluted the original long-tail intent and stalled rankings.
If the score rises but position stays flat, stop rewriting and start diagnosing competitiveness and intent mismatch.
Tool #3: Technical crawler
A paid crawler earns its keep when growth stalls for “no reason.” You use it to find invisible technical drag, then turn that into tickets.
Use case
You run a crawler when Search Console looks fine, but performance says otherwise. The goal is to turn crawl data into a short, ranked fix list.
A paid crawl surfaced four high-impact buckets:
- Crawl waste: faceted URLs, parameter loops, and endless calendar paths.
- Broken templates: paginated pages returning 200 with empty bodies.
- Canonical errors: category pages canonicalized to the homepage.
- Orphan pages: revenue articles with no internal links.
Prioritization was simple: fix anything that blocks indexing first, then anything that dilutes internal signals. The crawler didn’t “find issues.” It found the fastest path back to stable growth.
Fix rollout
Run fixes like a release plan, not a scavenger hunt.
- Audit in the crawler, then export issues by template and directory.
- Create tickets with one URL example, one rule, and expected crawl change.
- Dev QA on staging with a mini-crawl of only affected templates.
- Deploy in batches, then re-crawl at day 7 and day 21.
- Re-submit key sitemaps, then monitor logs for crawler shifts.
In practice, the audit took 1 day, ticket writing took 0.5 day, and QA took 2 days. The real delay was the dev queue, which added 10 business days. Your timeline is mostly throughput, not analysis.
60-day results
Track outcomes by page group, not site-wide averages.
| Metric | Day 0 | Day 60 | Notes |
|---|---|---|---|
| Valid indexed URLs | 18.2k | 21.9k | Orphans fixed |
| Excluded (canonical) | 6.4k | 2.1k | Wrong canonicals |
| Googlebot hits/day | 92k | 61k | Less waste |
| Facet URLs crawled | 28% | 9% | Params blocked |
| Category pages indexed | 4.1k | 3.6k | Noindex mistake |
One fix backfired for two weeks: a broad noindex rule caught paginated category pages. Rankings dipped until the rule was scoped to facets only. Technical wins are real, but regressions are faster than recoveries.
Lessons learned
The biggest wins came from canonical and internal linking fixes, not from “perfect” crawl health scores. Most warnings were noise, like minor redirect chains on low-value URLs.
Keep audits lightweight by crawling only what you can fix this sprint. If you can’t write a ticket from the finding, it’s trivia, not ROI.
Tool #4: Backlink platform
A paid link intelligence and outreach platform earns its keep when it changes your link decisions, not just your reports. The ROI shows up fast when you stop chasing “more links” and start reclaiming equity you already paid for.
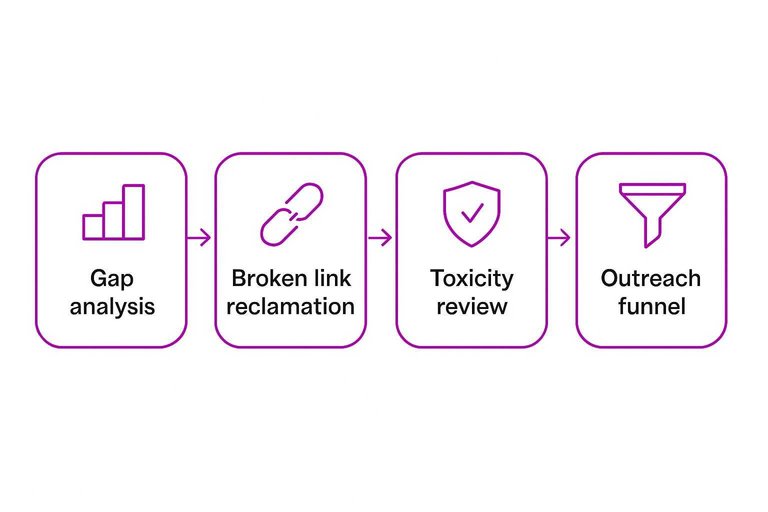
Use case
You used the platform to answer one question: “Where are we losing to competitors, and what can we safely win back?” The work combined competitor gap analysis, broken link reclamation, and a toxicity review to avoid trading rankings for risk.
Quality criteria used:
- Relevance: same topic cluster, not just “marketing” broadly
- Authority: real traffic signals, not only high DA/DR
- Placement: in-body editorial link, not footer or author bio
- Indexing: linking page indexed and stable
- Intent fit: page supports the target query, not random mentions
The platform’s biggest value was saying “no” faster than your inbox could.
Outreach math
You measured the outreach like a funnel, not a vibe. Staffing assumptions stayed fixed so the tool had to produce efficiency.
- Prospects sourced: 320 domains
- Emails sent: 210 targets
- Reply rate: 12% positive, 6% negative
- Placements: 9 net new links
- Cost per acquired link: $172
Assumptions: 6 hours/week from one SEO, $60/hour loaded cost, plus a $499/month tool.
If your cost per link is rising, your targeting is the leak, not your templates.
60-day results
In 60 days, you gained 9 new links and reclaimed 6 lost links from previously linking pages. The reclaimed links were the quiet win because they restored authority without new content or new relationships.
You saw 410 referral sessions from those placements and 7 assisted conversions in analytics. Rankings moved on two pages, but the biggest keyword group stayed flat because the pages still needed on-page refreshes and internal links.
Link tools can recover equity quickly, but they can’t outrank weak pages for you. (If you’re standardizing how you attribute “referral” and campaign traffic in GA4, review traffic-source dimensions and manual tagging.)
What changed
Replies were low in week two, so you changed the process instead of blaming “outreach fatigue.” You narrowed targeting to pages with existing outbound citations, personalized with a specific broken reference, and changed the offer to a direct replacement URL plus a one-paragraph rewrite suggestion.
You stopped three things: bulk domain scraping, generic “resource page” pitches, and chasing high-metric sites with zero topical overlap. You also paused outreach to sites with obvious sponsored-link footprints, even when metrics looked great.
The moment you treat links like partnerships, your reply rate stops being random.
Tool #5: Reporting automation
Use case
You buy a reporting connector to stop stitching screenshots and CSVs every Monday. One dashboard pulls GSC, GA4, your rank tracker, and CRM into a single weekly readout.
Example: the team debates “leads are down” while SEO insists “organic is up,” because everyone uses a different source.
If you’re standardizing your stack beyond reporting, tools to supercharge content workflows can help you pick systems that keep handoffs and visibility clean across teams.
Implementation steps
Set it up once so reporting stops being a recurring project.
- Connect GSC, GA4, rank tracker, and CRM data sources.
- Define KPIs and shared definitions in a one-page glossary.
- Build role-based views for SEO, content, and sales.
- Set alerts for anomalies and missing data refreshes.
- Document dashboard ownership and the change process.
Ownership is the real feature, not the connector.
60-day results
Two months is enough to feel the compounding effect of less reporting.
- Saved 6–10 hours per week on manual reporting.
- Cut “whose number is right” disputes by half.
- Shipped 2 extra SEO experiments per month.
- Resolved confusion on “Organic sessions” vs “Organic engaged sessions.”
Speed shows up as shipped work, not prettier charts.
Lessons learned
Automation wins at consistency and distribution, not interpretation. Manual analysis still matters when you diagnose cannibalization, intent shifts, or attribution edge cases.
Prevent dashboard sprawl with a rule: every chart has an owner, a decision it supports, and a deletion date. Otherwise, you build a museum.
Turn These 60 Days Into a Repeatable ROI System
- Lock your baseline and ROI rule: document starting rankings/traffic/leads, tool + labor costs, and what counts as revenue impact.
- Tie each tool to one job-to-be-done: one primary use case, one set of pages, one success metric to avoid “tool sprawl.”
- Run two-week checkpoints: ship fixes/content/outreach in batches, annotate releases, and watch for lagging effects rather than daily noise.
- Keep what compounds, cut what doesn’t: renew tools that produced measurable page-level gains, downgrade those that only improved reporting comfort, and re-test with a tighter scope next cycle.
Turn Tools Into Traffic
These 60-day ROI examples prove paid SEO tools work—but only when you can execute consistently across keywords, content, and reporting without losing momentum.
Skribra turns that stack into a daily publishing engine with SEO-optimized articles, WordPress integration, reporting-friendly outputs, and a backlink exchange network—start with a 3-Day Free Trial.
Written by
Skribra
This article was crafted with AI-powered content generation. Skribra creates SEO-optimized articles that rank.
Share: