May 4, 2026
·
11 min read
9 ranking website tool limitations at 1,000 keywords
A practical collection of rank-tracking realities at the 1,000-keyword tier—understand data freshness ceilings, locale/device blind spots, SERP feature misreads, sampling caps, accuracy-speed tradeoffs, noisy reporting, and integration/API breakpoints so you know what your dashboard can’t tell you.

You hit 1,000 tracked keywords and suddenly your “rankings” stop feeling like a reliable instrument. Updates lag, locations blur, SERP features hijack positions, and reports turn into a mess of alerts and averages.
This collection walks you through the most common limitations that appear at this scale—and how to spot them fast. You’ll learn where tools quietly sample or cap data, why speed can undermine accuracy, and what to ask before you trust a chart enough to make budget or content decisions.
Reality Check First
“1,000 keywords” sounds like a neat round number. Operationally, it’s a tracking system under load. Tools diverge because they sample different SERPs, at different times, with different rules.
What 1,000 Means
Tracking 1,000 keywords isn’t one task. It’s a matrix of choices that multiplies queries and storage fast.
Count the multipliers you actually run:
- Locations: country, city, ZIP-level
- Devices: desktop, mobile
- SERP features: maps, AI blocks, snippets
- Frequency: daily, weekly, on-demand
- Projects: domains, subfolders, competitors
- History depth: 30 days vs 24 months
If you track “1,000 daily, mobile+desktop, 5 locations,” you’re not tracking 1,000. You’re tracking 10,000.
Where Rankings Break
At 1,000 keywords, the problem stops being “did it rank.” The problem becomes “which SERP did you mean.”
Common failure points:
- SERP volatility shifts results hour to hour
- Localization changes packs and organic order
- Personalization leaks via language and history
- Mixed intent reshuffles types of pages
- Crawling limits miss new or blocked URLs
If the SERP is unstable, your rank is a moving target, not a measurement.
Tool Output Variance
Two tools can both be “right” and still disagree. They may be observing different SERP snapshots.
Variance usually comes from:
- Data sources: live scrape vs panels
- Refresh timing: 6am vs 6pm
- Proxy pools: IP ranges and geos
- Parsing rules: what counts as a result
- SERP features: inclusion or exclusion logic
When you compare tools, compare their methodology, not their numbers.
Viability Questions
Before you judge limitations, decide what “good enough” means for your work. Precision without usability still fails.
Key evaluation questions:
- What accuracy error can you tolerate?
- How fresh must updates be?
- Who operates the workflow daily?
- What reporting format is required?
- Which hidden costs are acceptable?
Pick the constraints first. Then the tool choice gets obvious.
Data Freshness Ceiling
At 1,000 keywords, many rank trackers stop feeling “real-time” and start feeling scheduled. Your dashboard can look calm while Google is moving underneath you.
| Refresh policy | What you see | Hidden delay | Decision risk |
|---|---|---|---|
| Daily, fixed time | One update batch | 6–24 hours | Late reaction |
| Weekly, same day | Monday-only changes | 1–7 days | Missed trend |
| Staggered cohorts | Mixed-date ranks | 1–3 days | False comparisons |
| On-demand, limited | Token-gated refreshes | Hours to days | Overuse throttling |
| “Fresh” top subset | Head terms updated | Long tail stale | Skewed priorities |
If your refresh window exceeds your release cycle, you’re steering with last week’s weather.
Locale and Device Gaps
At 1,000 keywords, “where” and “on what device” stops being a detail. It becomes a source of false confidence when your tool collapses everything into “global.”
Geo Granularity Limits
City and state tracking is expensive, slow, and quota-heavy at scale. So most teams fall back to country-level checks and call it representative.
Country tracking smooths real volatility.
A handful of cities can drop while the national average looks flat.
You’ll see “stable” graphs while revenue geos bleed.
The tradeoffs look like this:
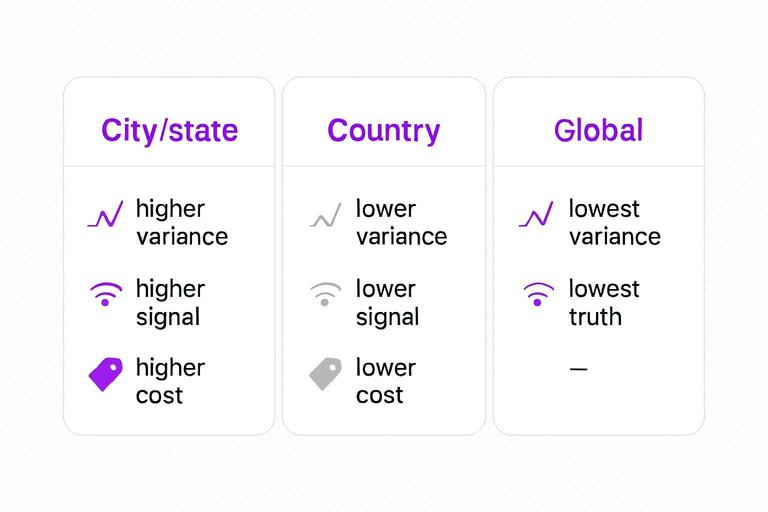
- City/state: higher variance, higher signal, higher cost
- Country: lower variance, lower signal, lower cost
- “Global”: lowest variance, lowest truth
If you track fewer locations, you don’t reduce noise. You hide losses.
Mobile vs Desktop Drift
Mobile and desktop SERPs are different products. Your rankings diverge because Google shows different layouts and competitors.
- Show different SERP layouts
- Trigger different SERP features
- Surface app packs differently
- Compete with different domains
If your tool averages devices, you’re measuring a blended SERP that nobody actually sees.
Personalization Leakage
“Neutral” results are a myth at scale. Even logged-out scraping inherits signals from IP ranges, language headers, and prior query patterns.
Depersonalized modes help, but they don’t reset everything.
Expect smaller swings, not identical SERPs.
That “incognito rank” is still a profile. Just a thinner one.
International Edge Cases
International SERPs have more moving parts than a rank checker admits. At 1,000 keywords, edge cases stop being rare.
- Mix languages across queries
- Redirect via ccTLD rules
- Block with consent walls
- Swap in regional SERP features
When your tool can’t model these, your “international visibility” becomes a story your dashboard tells you.
SERP Features Blindspots
At 1,000 keywords, SERP features stop being edge cases and become your main ranking variable. “Position” turns into a weak proxy, because the page layout decides the clicks.
Feature Collision
A numeric rank assumes ten blue links and a straight line of clicks. Real SERPs stack modules, and each one steals or redirects attention.
A keyword can show an AI Overview, then a featured snippet, then PAA, then a local pack, then a carousel. Your “#2” blue link might be the fifth thing seen.
Click opportunity is a layout problem, not a math problem.
Ambiguous Positioning
“#3” sounds precise, but SERPs make it situational. The same rank can mean wildly different visibility.
- Above-the-fold modules push you below the scroll
- Multiple modules appear before any organic results
- Blended results insert videos, images, or news
- Your listing repeats via sitelinks or subpages
- Device layouts reorder the entire stack
Treat “#3” as a label, then verify the layout.
Ownership Misattribution
Tools often assign ownership to the wrong URL when Google groups results. Host crowding, sitelinks, and “same-site” clustering can turn one ranking into several.
You’ll see a report that says your blog post ranks, but the click goes to a sitelinked product page. Or the tool credits your canonical, while Google shows a parameterized URL.
Bad attribution corrupts visibility math, so fix URL mapping before you trust trends.
Feature Tracking Gaps
Most rank trackers measure what’s easy, not what’s driving clicks. At 1,000 keywords, the gaps become systematic bias.
- AI modules and citations within them
- Local pack share by position
- Video placements within blends
- Shopping units and product grids
- PAA expansion depth and triggers
If it isn’t tracked, it still moved your traffic.
Sampling and Caps
At 1,000 keywords, rank tracking turns into capacity planning, not just measurement. Limits, sampling, and plan caps quietly reshape your dataset until it stops matching reality.
Keyword Slot Economics
Most tools don’t count a “tracked keyword” as one keyword. They count each combination of location, device, engine, and sometimes tags or folders.
Example: 1,000 keywords × 2 locations × 2 devices becomes 4,000 tracked rows fast. Add Google and Bing, and you’re staring at 8,000 before you touch “Canada” or “mobile.”
If your plan caps you at 1,000, you aren’t tracking less. You’re tracking different.
Hidden Sampling Practices
Sampling rarely shows up as a warning banner. You feel it as weirdness in your charts and gaps in your exports.
- Ranks flip without matching SERP changes
- SERP details disappear on random days
- Graphs look smoothed, not jagged
- Updates slow during traffic peaks
- “Last checked” timestamps drift
If you see three or more, you’re looking at a sampled dataset. For more on keeping your SEO measurement grounded, see this practical SEO guide.
Project Segmentation Pain
To fit caps, you split keywords into multiple projects. That “fix” breaks continuity, like resetting a fitness tracker mid-marathon.
History gets fragmented across projects. Tags drift, naming conventions fork, and cross-site comparisons become spreadsheet work.
The cost isn’t the split. It’s the analysis debt that follows.
Overage Cost Traps
Most overages aren’t labeled “overage.” They’re scattered as small line items that spike once you scale past 1,000 keywords.
- Add-on locations priced per pack
- API units burned by refreshes
- Extra competitors charged per project
- SERP storage billed by volume
- User seats required for sharing
Your bill grows in the same places your dataset gets thinner.
Accuracy vs Speed Tradeoff
At 1,000 keywords, ranking tools start choosing between “fast enough” and “true enough.” If you push refresh speed, you usually lose fidelity through proxies, throttles, and simplified SERP capture.
Proxy Pool Quality
Proxy quality decides whether you’re seeing Google or an obstacle course of blocks and captchas. At 1,000 keywords, cheap pools repeat IPs, blur location, and quietly change the SERP you collect.
Good proxy diversity looks like this:
- Many unique IPs, not recycled ones
- Stable geo targeting, not “nearby” guesses
- Low captcha rates, not constant challenges
- Consistent user-agents, not random fingerprints
If your tool “updates fast” on bargain proxies, it may be ranking its own proxy reputation.
Throttle Side Effects
To run 1,000 keywords quickly, tools throttle requests to avoid bans and costs. That safety valve creates its own data problems.
- Produce stale ranks during spikes
- Skip days for some keywords
- Delay alerts past useful windows
- Capture inconsistent SERP snapshots
When throttling kicks in, your trendline becomes a scheduling artifact, not a market signal.
Verification Workflows
You can validate accuracy without rechecking all 1,000 keywords. Use small, repeatable audits that catch drift early.
- Spot-check a fixed cohort across devices and locations.
- Compare two engines or tools for the same keyword set.
- Audit your most volatile keywords on a set cadence.
- Manually verify outliers like “jumped 30 spots” events.
Do it weekly, and you’ll learn which movements are real versus tooling noise.
When Precision Matters
Sometimes “directionally correct” rankings are not enough. You need higher fidelity when decisions get expensive or public.
- Reconcile paid and organic overlap
- Track brand crises and PR spikes
- Validate migrations and replatforms
- Report local SEO performance
If money or reputation rides on the chart, buy precision and slow down.
Reporting Gets Noisy
At 1,000 keywords, dashboards stop behaving like instruments and start behaving like weather. You still get charts, but the “insights” blur because averages drown out the shifts that matter. You’ll hear, “Visibility is up,” while revenue stays flat.
Vanity Metrics Drift
Keyword sets get wider, and averages get smoother. Your mean position can improve while your money pages slide, because long-tail gains offset head-term losses.
Visibility scores drift the same way. A 3% “visibility” lift can come from low-volume terms moving 40→12, with no traffic change.
Treat those scores as smoke alarms, not diagnoses.
Alert Fatigue Patterns
At 1,000 keywords, alerts multiply faster than your capacity to act. The system trains you to ignore it.
- Over-triggering on normal volatility
- Under-triggering on slow declines
- Duplicate alerts across tags
- Alerting on SERP feature churn
If your alerts don’t map to decisions, they’re just notification debt.
Segmentation That Holds
You need segments that survive noise and still explain outcomes. The goal is fewer buckets, each tied to a business lever.
- Cluster keywords by intent, not topic labels.
- Group by page template, like PDPs or guides.
- Split by market, like US vs UK.
- Separate by business line, like SaaS vs services.
- Track each segment against one KPI.
If a segment can’t answer “what should we change,” it’s not a segment.
Client-Friendly Outputs
Stakeholders don’t want 40 widgets and a “visibility” dial. They want a short list they can act on in 10 minutes.
- Top movers with a reason
- Cannibalization notes by URL
- Wins and losses by page
- Action queue with owners
Your best report is the one that turns into tickets.
Integrations and APIs Stall
At 1,000 keywords, integrations stop feeling like “nice-to-have” and start acting like a hard ceiling. Exports crawl, connectors time out, and APIs turn routine checks into a budgeted workflow—especially if you’re trying to unlock daily SEO gains with AI.
Export Limits
Most rank tools treat exports as a side feature, not a pipeline. At 1,000 keywords, row caps, slow CSV generation, and report queues turn “pull a quick cut” into a waiting game.
You’ll hit limits like 5,000 rows per export, or “one export at a time,” right when you need segmentation. Even when exports work, they arrive as wide, messy CSVs that choke Sheets and force manual cleanup.
Ad-hoc analysis dies first, so your team starts arguing from screenshots.
API Quota Reality
APIs look unlimited until you do daily refresh math. At 1,000 keywords, the quota becomes your actual product.
- Hit rate limits during morning refresh windows
- Burn credits on “unchanged” keyword pulls
- Fight pagination to rebuild full snapshots
- Pay extra for historical snapshots
You either cache aggressively or accept stale reporting.
Data Warehouse Fit
BigQuery or Snowflake only works if the tool’s data is warehouse-shaped. You need stable keyword IDs, consistent project IDs, and a history table you can append without rewriting yesterday.
Without that, you’re forced to dedupe with brittle rules like “keyword + location + device,” and one renamed tag breaks joins. The best setups also define late-arriving data rules, because rank updates rarely land perfectly on schedule.
If you can’t trust IDs and history, you can’t trust trends.
Toolchain Breakpoints
Connectors are fine at small volumes, then silently degrade under daily refresh loads. At 1,000 keywords, the weak link shows up fast.
- Looker Studio connector times out mid-refresh
- Sheets import hits cell or query limits
- Slack alerts flood channels with noise
- BI dashboards lag or fail scheduled runs
When the toolchain breaks, teams stop checking it.
Turn 1,000 Keywords Into Decisions, Not Noise
- Define what “good enough” accuracy means for your use case (daily direction vs. page-level proof) before you pick refresh frequency or verification steps.
- Stress-test the tool on a small, high-value set (brand + money terms + volatile SERPs) across device and key locales to reveal drift, caps, and feature confusion.
- Design reporting around decisions: segment by intent/page/template, track SERP feature ownership, and limit alerts to thresholds you’ll actually act on.
- Plan the data path early—exports, API quotas, and warehouse schema—so 1,000 keywords doesn’t become the point where your workflow breaks.
Turn Rankings Into Growth
At 1,000 keywords, tracking data gets noisy and incomplete, so the real advantage comes from publishing consistently and improving what you can control.
Skribra helps you scale daily SEO-optimized content with WordPress publishing, smart formatting, and built-in backlinks—so performance compounds even when rank tools hit their limits. Start with the 3-Day Free Trial.
Written by
Skribra
This article was crafted with AI-powered content generation. Skribra creates SEO-optimized articles that rank.
Share: