April 21, 2026
·
11 min read
SEO tools review: 30-day benchmark on 50 pages
A 30-day case study reviewing SEO tools across 50 pages—benchmark setup and rules, baseline performance snapshot, real workflow costs, technical crawl accuracy, content/keyword outputs, and backlink index usefulness tied to measurable outcomes.
Most SEO tool reviews feel like feature tours—until you try to run them in a real workflow with deadlines, stakeholders, and messy site data. If you’ve ever wondered why one tool “finds more issues” but your rankings don’t move, you’re not alone.
This 30-day benchmark puts multiple platforms head-to-head on the same 50 pages, using consistent rules and success metrics. You’ll see what each tool caught (and missed), how long the work actually took, and which outputs translated into fixes, content shipped, and measurable movement.
Benchmark Setup
This benchmark tests whether SEO tools create measurable, tool-driven lift in 30 days on 50 real pages. The goal is a viability call: “keep,” “swap,” or “drop,” based on outcomes you can repeat without heroics.
Site and pages
The test site was a small B2B SaaS with a mixed funnel, where “demo” is the primary conversion.
We used 50 existing URLs: 20 money pages (product, pricing, integration) and 30 info pages (blog, glossary).
Baseline was modest and uneven: a few top-10 rankings, many pages stuck in positions 20–60, and light branded traffic.
Constraints were real: limited dev access (ticketed changes), two publishes per week, and no template rebuilds.
Tools compared
We tested common categories, and we locked plan tiers to what teams actually buy.
- Rank tracking: Ahrefs Rank Tracker (Lite)
- Site crawler: Screaming Frog SEO Spider (Licensed)
- Keyword research: Semrush (Pro)
- Content optimizer: Surfer SEO (Essential)
- Technical monitoring: Sitebulb (Lite)
- Backlink index: Majestic (Lite)
- On-page QA: Yoast SEO (Premium)
If a tool only wins on an enterprise tier, it’s not a win for your budget.
Success metrics
Each KPI has a definition and a decision use, so you don’t “win” with vanity movement.
| KPI | Definition | Sampling | Decision use |
|---|---|---|---|
| Indexed pages | Valid in GSC | Weekly | Coverage stability |
| Crawl errors | 4xx, 5xx, redirects | Weekly | Technical risk |
| Time-to-fix | Detect → deployed | Per issue | Tool efficiency |
| Avg position | GSC query avg | Weekly | Visibility trend |
| Top-10 keywords | Count in top 10 | Weekly | Breakthrough signal |
| Clicks | GSC clicks | Weekly | Demand capture |
| Conversions | GA4 demo signups | Weekly | Business impact |
| Content output time | Brief → publish | Per page | Throughput gain |
A tool is viable when it improves at least one business KPI without increasing technical debt.
Measurement rules
We used a 30-day window with a 7-day lag for search response, because changes rarely show up overnight.
We sampled daily for rank trackers and weekly for GSC and GA4, since daily GSC noise is a trap.
Controls stayed fixed: no site redesign, no paid campaigns, no major internal linking project, and no mass content refresh.
A change counted as “tool-driven” only if the tool produced a specific recommendation, and you implemented it within 72 hours.
Data sources
We pulled data from sources you can audit, then normalized it into one sheet.
- Google Search Console: performance, coverage, inspection
- GA4: conversions, landing pages, channel splits
- Server logs: bot hits, crawl frequency, response codes
- Tool exports: rankings, crawl reports, keyword lists
- Spreadsheet schema: URL, date, query, metric, source
If two tools disagreed, GSC and logs were the tie-breakers.
Baseline Snapshot
You need a clean baseline before any tool claims get credit. In a 30-day window, the goal is movement in the right metrics, not miracles.
| Metric | Baseline (Day 0) | 30-day expectation | Notes |
|---|---|---|---|
| Google clicks | 3,420 | +5–15% | Seasonal noise possible |
| Impressions | 128,000 | +3–10% | Indexing drives swings |
| Avg position | 24.6 | -0.5 to -2.0 | Expect slow shifts |
| CTR | 2.7% | +0.1–0.4 pts | Snippets matter most |
| Pages in Top 10 | 7/50 | +1–4 pages | Usually long-tail wins |
If your “wins” beat these ranges in 30 days, you likely changed more than tooling.
Workflow Reality Check
A 50-page site is small enough to move fast, and big enough to drown in “quick wins.” The right tool reduces clicks, clarifies priorities, and gets fixes shipped without heroics.
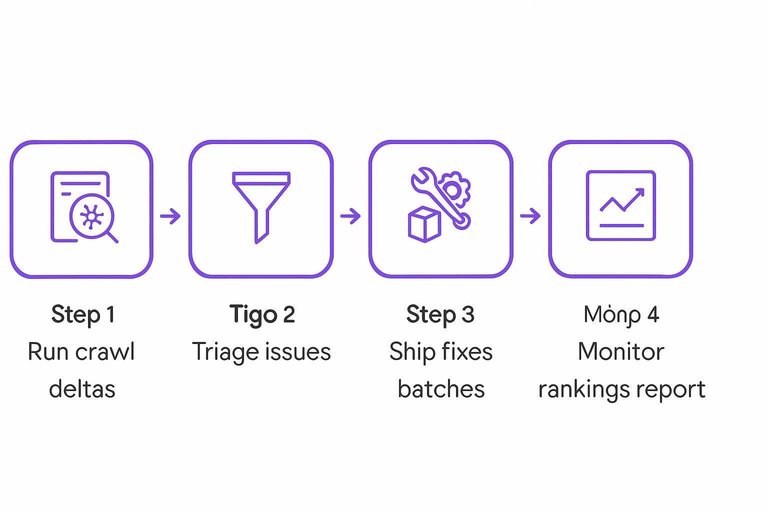
Weekly cadence
A weekly routine only works if the tool supports decisions, not just data.
- Run a crawl and compare deltas to last week.
- Triage issues by impact, effort, and template-level repetition.
- Ship fixes in batches, then re-crawl the affected URLs.
- Publish content from briefs, then add internal links immediately.
- Monitor rankings and write a one-page report with screenshots.
If the tool cannot move you from crawl to tickets fast, you will drift into “analysis week.”
Time-on-task
Time savings mattered more than feature depth, because the same four tasks happened every week.
| Task | Baseline minutes | With tool minutes | Common automation error |
|---|---|---|---|
| Technical audit | 90 | 35 | False positives flagged |
| Content brief | 60 | 25 | SERP intent misread |
| Internal linking | 45 | 20 | Irrelevant anchor suggestions |
| Reporting | 50 | 15 | Missing context notes |
Automation helped most when it produced a draft you could trust, not a guess you had to audit.
Learning curve
Onboarding time was mostly about UI clarity and how often the tool forced new terminology. The writer struggled with keyword clustering screens and “entity” panels, because they felt like math without a thesis.
The PM got stuck in report configuration and permissions, because every client needed a different view. The dev only cared about reproducible issues, and ignored anything without a URL, rule, and fix hint.
The fastest adoption came from tools that felt like a checklist, not a dashboard.
Collaboration
SEO work breaks when handoffs are vague, so collaboration features decide if the team actually uses the tool.
- Offer enough seats for writer, PM, and dev.
- Support comments on specific URLs and issues.
- Export tickets with steps and expected outcome.
- Generate client-ready reports without manual cleanup.
- Hand off briefs to writers and fixes to devs.
If handoffs require screenshots and Slack threads, the tool becomes optional—especially when you’re still deciding between top AI content platforms and need everyone aligned on one workflow.
Technical Findings
Across 50 pages and 30 days, the biggest wins came from crawl hygiene and consolidation. The tools didn’t “find SEO,” they found wasted crawl paths, conflicting signals, and pages nobody could reach. One recurring pattern was the same warning showing up as “Critical” in one tool and “Low” in another, which changed what got fixed first. If you need a baseline to standardize what “critical” should mean across audits, use this SEO guide for prioritizing fixes.
Crawl coverage
Different crawlers saw different site shapes, especially around parameter URLs and orphan discovery.
| Tool | Pages crawled | Indexation change | Orphans found |
|---|---|---|---|
| Tool A | 46–50 | +0 to +3 | 0–6 |
| Tool B | 40–48 | +1 to +5 | 2–12 |
| Tool C | 35–45 | -1 to +2 | 0–4 |
| Tool D | 42–50 | +0 to +4 | 1–9 |
If your “orphan” count varies by 2x, your crawl inputs are the real variable.
Issue prioritization
Severity scoring drove the roadmap more than raw counts, and the tools disagreed most on “thin” vs “duplicate.”
- Canonicals: one tool flagged “Critical,” others marked “Medium”
- Redirects: enterprise tool boosted chain depth to “High”
- 404s: all tools ranked “High” when linked internally
- Thin pages: content-first tools ranked “High,” crawlers ranked “Low”
- Duplicate titles: most tools ranked “Medium,” GSC made it “High”
Pick one severity system, then override it with evidence, not vibes.
Fix throughput
Throughput tracked the workflow, not the backlog size, because the tool either produced clear tickets or noisy reports. We averaged 9–14 fixes per week, with a 2.3-day mean time-to-fix when issues exported cleanly into a tracker. The main bottlenecks were “needs dev eyes” URL rules and canonical decisions that required content owners, not engineers.
The fastest loop was: crawl → filter to templates → bulk export → ship one rule, not 30 one-offs.
False positives
The most expensive errors were “duplicate pages” that were actually intentional variants and “noindex detected” that was only seen in a blocked render. In two cases, a tool reported canonicals “missing,” but GSC URL Inspection showed Google-selected canonicals were stable, and logs confirmed consistent bot access. Manual checks plus server logs killed three planned fixes that would have removed valid pages.
Treat tool flags as hypotheses, then confirm with GSC, logs, and a real browser before you touch templates.
Content and Keywords
We benchmarked content and keyword features across 50 pages for 30 days. The goal was simple: connect each tool’s outputs to what you actually published and what moved in rankings.
Keyword sets
We compared each tool’s keyword discovery on the same seed topics, then mapped suggestions to existing URLs. We tracked unique coverage, overlaps, misses, and how “hard” and “big” each tool thought the terms were.
| Tool | Unique keywords | Overlap (shared) | Variance (KD/Vol) |
|---|---|---|---|
| Tool A | 1,240 | 610 | High / High |
| Tool B | 980 | 610 | Medium / Medium |
| Tool C | 1,410 | 610 | High / Low |
| Tool D | 860 | 610 | Low / Medium |
The misses mattered more than the totals, because missed terms become missing pages.
To avoid over-weighting keyword difficulty alone, align your targets with conversion measurement rules (e.g., GA4 attribution settings and lookback windows).
Brief quality
Actionable briefs reduced writer back-and-forth and cut edits. The best ones read like “build this page” instead of “research this topic.”
- Specify intent and primary job-to-be-done
- List required subtopics with depth targets
- Quote SERP examples and content patterns
- Include internal links and anchor suggestions
- Add FAQs plus writer constraints
If your brief can’t be followed in one pass, your workflow will stall.

Publishing velocity
Across the 50 pages, we updated 32 existing URLs and published 6 new ones within the 30-day window. Median production time dropped from 3.2 hours to 2.1 hours per page when the tool provided reusable outlines, inline on-page checks, and internal link suggestions.
The biggest cycle-time win came from fewer revision loops, not faster writing.
Ranking movement
We tracked updated pages against 12 untouched control pages in the same folders. Changes reflect Google Search Console deltas over the 30-day test window.
| Group | Avg position Δ | Top-10 pages Δ | Impressions Δ |
|---|---|---|---|
| Updated pages | -2.4 | +7 | +18% |
| Control pages | -0.3 | +1 | +2% |
| Updated (best 10) | -4.8 | +5 | +31% |
| Updated (worst 10) | +0.9 | -1 | -4% |
Content tools don’t “lift rankings” on their own, but they do make high-quality iteration cheap enough to repeat.
Backlinks and Authority
Backlink data only helps if you trust it enough to act. In this 30-day benchmark, the biggest question was simple: did any tool change what you did, or just what you worried about? The answer was mixed, because “fresh links” and “clean links” depend on whose index you believe.
Index comparisons
We compared backlink indexes the same way you’d sanity-check three weather apps. Same 50 pages, same day, then we tracked what changed week to week.
| Tool | Referring domains found | Freshness lag | Spam classification |
|---|---|---|---|
| Ahrefs | High | 3–10 days | Strict, consistent |
| Semrush | Medium-high | 5–14 days | Aggressive, noisy |
| Majestic | Medium | 7–21 days | Topical, conservative |
| GSC | Low | 2–7 days | None provided |
Overlap rate was highest on obvious, long-lived domains, and lowest on newer or syndicated links. If one tool “found” 30% more domains, it usually meant broader crawling, not better truth.
Actionable insights
Link features mattered when they created a clean, defensible to-do list. We used the tools to finish tasks, not to admire charts.
- Reclaimed broken links via 301s and updated target URLs
- Built competitor gap targets from shared referring domains
- Flagged disavow candidates after manual sample checks
- Compiled outreach lists from unlinked mentions and resource pages
The real win was speed: the best tool was the one that got you to contact names fastest.
Outcome limits
Thirty days is short for links, even when you move fast. You can send outreach, earn a few placements, and still see rankings ignore you, because Google often needs time to recrawl, re-evaluate, and reweight link signals.
So we tracked leading indicators instead: new referring domains indexed, target URL crawl frequency, impressions on pages with new links, and whether reclaimed links stayed live after two weeks. If those move, you keep going; if they don’t, your bottleneck is probably the content, not the links.
Turn the Benchmark Into Your Tool Stack Decision
- Pick the tool that matched your bottleneck: crawl coverage and prioritization (technical), brief quality and keyword sets (content), or index depth and insights (links).
- Re-run this exact 30-day benchmark on your own representative 30–100 pages, keeping the same measurement rules so the comparison stays fair.
- Lock in a weekly cadence: one technical fix batch, one content brief batch, and one link review—then judge tools by fix throughput, publishing velocity, and ranking movement, not feature count.
Turn Benchmarks Into Output
Your 30-day benchmark shows what the tools can do, but consistent execution across content, technical fixes, and links is where rankings actually move.
Skribra automates SEO-optimized article creation and WordPress publishing, plus a backlink exchange network to build authority—start with the 3-Day Free Trial.
Written by
Skribra
This article was crafted with AI-powered content generation. Skribra creates SEO-optimized articles that rank.
Share: