June 6, 2026
·
10 min read
AI SEO platform results after 30 days: traffic lift
A 30-day case study framework for evaluating an AI SEO platform’s “traffic lift” — set realistic success criteria, run a clean test setup checklist, track the metrics that actually move (segmented traffic, visibility, engagement, conversions, crawl/indexing), and sanity-check attribution before you call it a win.
You turned on an AI SEO platform, shipped changes, and now you’re staring at Search Console wondering: is this a real lift or just normal volatility? In the first 30 days, it’s easy to over-credit tools for seasonal bumps, brand spikes, or indexing quirks.
This case study walks you through what a meaningful 30-day readout can (and can’t) prove. You’ll learn how to define “traffic lift,” pick success criteria, instrument the test, and interpret early signals without mistaking noise for impact.
30-Day Lens
Thirty days is enough to see motion, not enough to claim causation. You’re checking whether the system works, not declaring victory.
Fast signals often move first: pages get discovered, snippets change, clicks react. Slow signals lag: authority accrues, link graphs shift, and “good traffic” proves itself over time.
Treat a 30-day test like a shakeout run. You’re hunting for leading indicators and obvious failure modes.
What 30 days shows
Thirty days reveals how quickly your site responds to change. It also exposes where the bottleneck really lives.
You’ll usually see faster movement in:
- Indexing and crawl frequency
- Title and snippet CTR changes
- Ranking volatility on updated pages
- Internal link flow effects
You’ll rarely see stable movement in:
- Domain-level authority shifts
- Durable non-branded demand growth
- Consistent traffic quality improvements
- Long-tail coverage compounding
Use 30 days to validate mechanics, then extend the window to validate outcomes.
Define “traffic lift”
“Traffic lift” sounds precise until you define the numerator and the slice. Tight definitions prevent you from celebrating noise.
- Absolute sessions vs session share
- Organic-only vs all channels
- Branded vs non-branded queries
- New pages vs refreshed pages
- Adjusted for campaigns and seasonality
If you can’t isolate the slice, you can’t attribute the lift.
Decide success criteria
More clicks can be a vanity win if they don’t match intent. Decide what “viable” means before you look at the graph.
A clean 30-day success definition usually includes:
- Qualified visits to target pages
- Conversions or conversion rate direction
- Sales or pipeline influence signals
- Confidence level and measurement limits
Pick one primary outcome and one guardrail metric. Otherwise, you’ll optimize for whatever moved first.
Test Setup Checklist
Run the test like an experiment, not a vibe check. Your goal is one variable change, clean logs, and repeatable decisions.
- Freeze your baseline pages, keywords, and URLs before day one.
- Lock your other SEO workstreams to avoid overlapping changes.
- Define one success metric and two secondary metrics, with exact sources.
- Set a content and release cadence you can actually follow for 30 days—if you need a refresher, use this overview of what AI SEO tools do to align on definitions and tracking.
- Document every platform action, publish event, and rollback in a shared log.
If you can’t explain every change, you can’t trust the lift.
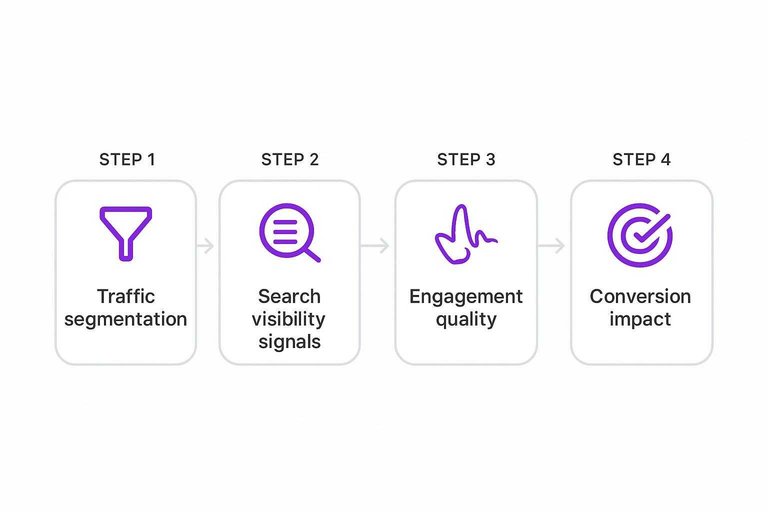
Metrics That Matter
Thirty days is enough to see signals, not verdicts. Your job is to collect metrics that separate real organic movement from normal variance, seasonality, and launch noise.
Traffic segmentation
You can’t call it a traffic lift until you isolate what actually moved. Segmenting upfront prevents you from crediting SEO for a paid burst or a social mention.
- Channel and source/medium splits
- Landing page type clusters
- Device category differences
- Geo and language splits
- New vs returning visitors
When the “lift” only appears in one slice, you found a cause, not a miracle.
Search visibility signals
Traffic is a lagging metric, especially in the first month. Search Console visibility signals move earlier and tell you if Google is reevaluating your pages.
Watch for impressions rising before clicks, which often means broader eligibility. Pay attention to average position by query group, not sitewide, because mix shifts can hide real wins. If queries move from branded to problem-based, you’re expanding demand capture. SERP feature changes matter too, since a new snippet or AI answer can reshape clicks without harming relevance.
If visibility improves while traffic stays flat, your next lever is CTR and snippet intent match.
Engagement quality
More sessions can still be worse traffic. Measure engagement to confirm you attracted problem-fit visitors, not drive-by curiosity.
- Engaged sessions versus bounces
- Scroll depth on key pages
- Time on page for intent-fit content
- Return visits within the period
- Internal navigation to money pages
If engagement rises on the right page types, you’re earning trust, not just clicks.
Conversion impact
Traffic only matters if it changes outcomes you care about. Track both micro conversions, like newsletter signups or demo page views, and macro conversions, like qualified leads or purchases.
Look at assisted conversions to capture content that starts journeys instead of ending them. Compare lead quality signals, such as fit notes or stage progression, rather than only form counts. When you ship AI-assisted content changes, annotate dates so downstream shifts have a clean explanation trail.
If conversions don’t move, your content may be ranking for the wrong job.
Indexing and crawl
Technical blockers can hide real content gains. Use these checks to confirm Google can actually fetch and trust what you shipped.
| Signal | Where to check | What you want | Common blocker |
|---|---|---|---|
| Coverage status | Search Console | Indexed pages rising | Excluded by rule |
| Crawl activity | Crawl stats | Stable fetches | Server throttling |
| Canonical signals | URL Inspection | Self-canonical | Wrong canonical target |
| Sitemap health | Sitemaps report | Submitted equals discovered | Stale sitemap URLs |
If indexing looks messy, fix crawl paths before judging content performance.
Attribution Reality Check
Thirty days is enough to see movement, but not enough to claim clean causality. Before you credit the platform, rule out the usual confounders.
| Confounder | What it looks like | How to detect | How to control |
|---|---|---|---|
| Seasonality and holidays | predictable traffic swings | YoY trend, calendar checks | compare YoY; annotate dates |
| Algorithm or SERP changes | sudden rank volatility | sensor tools, SERP diffs | isolate queries; widen window |
| Release and site changes | spikes after deploy | change log, crawl diffs | freeze changes; tag releases |
| Tracking and consent shifts | sessions drop, conversions shift | tag audit, consent logs | validate tags; segment regions |
| Content velocity changes | more pages, more impressions | publish log, index coverage | normalize by pages; cohorts |
If you can’t explain these first, you’re measuring coincidence, not lift.
Real-World 30-Day Example
Imagine a mid-sized site using an AI SEO platform for one month—say, something like Skribra that combines SEO-focused article generation with direct publishing workflows. You want a clean evaluation, not a victory lap. So you treat it like a controlled rollout, with a baseline, a change log, and a strict review cadence.
Baseline snapshot
You start by freezing a “before” snapshot, so later comparisons stay honest. Otherwise, you will credit the platform for momentum you already had.
Content inventory: you map key templates, thin pages, and outdated posts. Technical health: you scan indexability, canonicals, redirects, and crawl traps. Topical coverage: you cluster pages by intent, then mark gaps and overlaps. Demand patterns: you bucket queries into brand, non-brand, informational, and transactional, then note which buckets actually move.
If you cannot explain your baseline in plain English, you cannot trust the month-one story—especially when the platform can increase publishing velocity, because velocity can mask pre-existing trends if you do not anchor the starting point.
Changes shipped
You ship platform-driven changes, but you also log what you refused to touch. That “no” list protects your test.
-
Publish AI-assisted briefs for priority topics
-
Refresh decaying pages with clearer intent alignment
-
Add internal links from hubs to money pages
-
Implement schema on eligible templates
-
Prune or noindex pages with no role
-
Do not change navigation, design, or JS rendering
-
Do not rewrite every title tag at once
If your platform supports SEO formatting basics (like meta descriptions and consistent structure) and a cleaner publish flow (for example, pushing posts into WordPress without extra handoffs), keep those as explicit line items in the log. Restraint is the difference between measurement and mayhem.

Week-by-week readouts
You review weekly because daily data is noisy. Your goal is to catch breakage, not to chase every wiggle.
- Check GSC: impressions, clicks, query buckets, and page groups.
- Check indexing: new URLs, excluded reasons, crawl stats, and sitemap status.
- Check rankings: only for tracked clusters, not single keywords.
- Ignore: one-day spikes, weekend dips, and position churn on low-impression terms.
- Audit deeper when: key pages drop across many queries, or exclusions suddenly climb.
This matters even more if the platform makes it easy to publish consistently (and quickly), because you can unintentionally introduce lots of new URLs or refreshes in a short window. Your cadence is the guardrail that keeps the platform from becoming a slot machine.
Surprises and lessons
Month one often delivers weird signals before it delivers clean wins. That is normal, but only if you know what you are seeing.
Cannibalization shows up when a refreshed page starts stealing impressions from the page you meant to rank. Indexing delays happen when you publish, but Google parks the URL in “Discovered” limbo. Brand query inflation can make charts look healthier while non-brand stays flat. UX issues surface when better internal linking increases traffic to pages that load slowly or frustrate mobile users.
If you are using a system that streamlines frequent publishing and on-page SEO hygiene (like Skribra’s SEO-optimized output and automation-friendly workflows), these “surprises” often show up sooner simply because you are shipping more. Treat surprises as diagnostics: they tell you where your system breaks under more attention.
— Section 5: Interpreting “Lift” — —
A 30‑day “lift” can be real, or it can be weather. Your job is to separate movement you can repeat from movement you just happened to notice.
Subsections: [
{
“subheading”: “Signal vs noise”,
“content”: “Organic traffic is volatile, especially at page level. You need comparisons that control for seasonality, site changes, and random spikes.\n\nUse a few lenses at once:\n- Pre/post windows: compare the 30 days before and after launch.\n- Annotations: mark releases, migrations, PR hits, and tracking changes.\n- Matched-page cohorts: compare updated pages to similar untouched pages.\n- Query mix checks: confirm gains are not one new branded query.\n\nIf the \u201clift\u201d disappears when you remove one outlier page, it was never a lift.”,
“description”: “Differentiate meaningful trends from volatility using pre/post comparisons, annotations, and matched-page cohorts.”
},
{
“subheading”: “Leading vs lagging”,
“content”: “Some signals move fast, and some only show up after Google re-evaluates your site. You need a short list of leading indicators you\u2019ll accept as \u201cprogress.\u201d\n\n- Impressions up \u2192 demand capture improving\n- Indexation up \u2192 crawl and coverage healthier\n- CTR up \u2192 snippets and intent alignment improving\n- Qualified sessions up \u2192 rankings shifting on valuable queries\n- Conversions up \u2192 traffic quality actually improved\n\nDecide your wait time by indicator, or you\u2019ll keep restarting before compounding kicks in. For what compounding typically looks like beyond month one, see <a href="https://skribra.com/blog/ai-seo-tools-roi-after-90-days-for-smbs\”>AI SEO tools ROI after 90 days. If your CTR or clicks stall despite rising impressions, review <a href="https://skribra.com/blog/7-ai-seo-platform-mistakes-costing-organic-clicks\“>AI SEO platform mistakes costing clicks to spot common execution traps.”,
“description”: “Map early indicators (impressions, CTR, indexation) to later outcomes (qualified sessions, conversions) and decide what\u2019s acceptable to wait for.”
},
{
“subheading”: “Content-level diagnosis”,
“content”: “Aggregate charts hide the truth. Cohorts tell you whether the platform is lifting the work, or just reshuffling attention.\n\nRead movement by buckets:\n- Winners: pages that gained clicks and held them.\n- Decliners: pages that lost, especially on money queries.\n- Unchanged: pages that did the work, but got no response.\n\nThen assign likely cause. If winners share a template, it\u2019s execution. If they share a topic strategy, it\u2019s direction.”,
“description”: “Show how to read page cohorts: winners, decliners, and unchanged pages; infer whether strategy or execution caused movement.”
},
{
“subheading”: “Quality safeguards”,
“content”: “AI can scale output faster than your brand can absorb mistakes. Put gates in place before you judge results, or you\u2019ll optimize the wrong thing.\n\n- Check thinness: add unique examples, constraints, and specifics\n- Check duplication: detect near-copies across pages and templates\n- Check factual risk: verify claims, sources, and \u201cconfident\u201d wording\n- Check E\u2011E\u2011A\u2011T: add author stance, experience, and clear accountability\n- Check workflow: draft \u2192 edit \u2192 subject review \u2192 publish approval\n\nThe safest lift is the one you can keep publishing without fear\u2014and the one you can sustain with daily SEO gains with AI.”,
“description”: “Provide checks for thin content, duplication, hallucinated facts, and E-E-A-T risks; include review workflow and approvals.”
}
]
Signal vs noise
Organic traffic is volatile, especially at page level. You need comparisons that control for seasonality, site changes, and random spikes
Use a few lenses at once:
- Pre/post windows: compare the 30 days before and after launch.
- Annotations: mark releases, migrations, PR hits, and tracking changes.
- Matched-page cohorts: compare updated pages to similar untouched pages.
- Query mix checks: confirm gains are not one new branded query.
If the “lift” disappears when you remove one outlier page, it was never a lift.
Leading vs lagging
Some signals move fast, and some only show up after Google re-evaluates your site. You need a short list of leading indicators you’ll accept as “progress.”
- Impressions up → demand capture improving
- Indexation up → crawl and coverage healthier
- CTR up → snippets and intent alignment improving
- Qualified sessions up → rankings shifting on valuable queries
- Conversions up → traffic quality actually improved
Decide your wait time by indicator, or you’ll keep restarting before compounding kicks in. For what compounding typically looks like beyond month one, see AI SEO tools ROI after 90 days. If your CTR or clicks stall despite rising impressions, review AI SEO platform mistakes costing clicks to spot common execution traps.
Content-level diagnosis
Aggregate charts hide the truth. Cohorts tell you whether the platform is lifting the work, or just reshuffling attention.
Read movement by buckets:
- Winners: pages that gained clicks and held them.
- Decliners: pages that lost, especially on money queries.
- Unchanged: pages that did the work, but got no response.
Then assign likely cause. If winners share a template, it’s execution. If they share a topic strategy, it’s direction.
Quality safeguards
AI can scale output faster than your brand can absorb mistakes. Put gates in place before you judge results, or you’ll optimize the wrong thing.
- Check thinness: add unique examples, constraints, and specifics
- Check duplication: detect near-copies across pages and templates
- Check factual risk: verify claims, sources, and “confident” wording
- Check E‑E‑A‑T: add author stance, experience, and clear accountability
- Check workflow: draft → edit → subject review → publish approval
The safest lift is the one you can keep publishing without fear—and the one you can sustain with daily SEO gains with AI.
Make Your 30-Day Readout Decision-Ready
- Lock your definition of lift: which segments (non-brand vs brand, new vs existing pages) and which primary KPI you’ll judge.
- Re-check the setup: deployment dates, annotation, tracking consistency, and any parallel changes (site releases, campaigns, migrations).
- Read the signals in order: indexing/crawl → impressions and rankings → clicks → engagement and conversions, noting what’s leading vs lagging.
- Diagnose at the content level: winners, losers, and “no change” pages—then validate quality safeguards (intent match, accuracy, internal links).
- Choose the next move: scale what worked, iterate on unclear areas with a tighter test, or pause if attribution can’t be defended.
Turn Lift Into Momentum
A 30-day AI SEO platform test can reveal real signals, but sustaining the lift depends on publishing quality content consistently and tracking the right metrics.
Skribra helps you scale SEO-optimized articles with WordPress publishing, images, and backlinks built in—so your next 30 days compound. Start with the 3-Day Free Trial.
Written by
Skribra
This article was crafted with AI-powered content generation. Skribra creates SEO-optimized articles that rank.
Share: