June 18, 2026
·
9 min read
Set up an SEO timeline dashboard in GA4
A hands-on guide to setting up an SEO timeline dashboard in GA4—clarify the dashboard outcome and data flow, connect Search Console, harden GA4 tracking for clean landing-page reporting, choose the right dashboard tool, and build a reusable timeline dataset for Looker.
If your SEO reporting still lives in scattered screenshots and one-off spreadsheets, it’s hard to explain what changed—and when. GA4 can show the impact of content updates, technical fixes, and migrations, but only if your data is connected and consistently structured.
This guide walks you from the goal and stack to a working timeline dashboard: linking Search Console, tightening GA4 tracking and conversions, picking a dashboard tool, creating a timeline-ready dataset (including BigQuery options), and building the key Looker views you’ll actually use.
Goal and stack
You’re building one timeline view that tells the SEO story without tab-hopping. GA4 gives behavior and conversions, Search Console adds query and click context, and Looker Studio turns it into one scannable dashboard. A notes source ties actions to outcomes, so spikes stop being mysteries.
The stack is simple: GA4 + Search Console + Looker Studio, with BigQuery only if you need deeper history or joins. If you want to streamline setup and ongoing reporting, bookmark these resources to simplify SEO workflows. If you need a refresher on fundamentals, start with this SEO guide for the basics. The outcome is clarity, not another report.
Dashboard outcome
An “SEO timeline” dashboard is one page where time is the spine. You see sessions, conversions, and landing pages on the same date axis, plus annotations for releases and SEO changes.
It typically includes:
- Organic sessions and engagement over time
- Conversions and revenue events over time
- Top landing pages trending up or down
- Key events like migrations, rewrites, and indexing shifts
- Notes pinned to exact dates
Once annotations sit beside performance, debates turn into diagnostics.
Required access
You need access that lets you connect sources and trust the numbers. Get this sorted before you design anything.
- GA4 Editor access to the property
- Search Console verified property access
- Looker Studio edit access to the report
- BigQuery roles for export and queries
Permissions are the first dependency. Blocked access creates fake “data problems.”
Data flow map
The clean setup keeps each system doing what it’s good at. GA4 provides onsite behavior, GSC provides search visibility, and Looker Studio blends them for charts.
Typical flows:
- Search Console → Looker Studio (queries, clicks, impressions)
- GA4 → Looker Studio (sessions, events, conversions)
- GA4 → BigQuery → Looker Studio (optional history, joins, custom logic)
- Notes source → Looker Studio (manual or imported annotations)
Design the flow first. Your dashboard will inherit its limits and strengths.
Key decisions
A few choices decide whether your timeline stays stable or constantly “shifts.” Make them once, document them, and stick to them.
- Set one timezone for all sources
- Confirm reporting currency and conversion definitions
- Choose the default date range and comparison mode
- Decide: GA4 UI, Looker-only, or BigQuery-backed model
Pick consistency over cleverness. Trend trust beats perfect attribution.
Link Search Console
Connect Search Console to GA4 so your timeline dashboard can include queries and landing pages. You’re doing it now to avoid missing historical context later.
- Open GA4 Admin, then go to Product Links → Search Console Links.
- Click Link, choose the correct Search Console property, then select your web data stream.
- Confirm the URL match and permissions, then finish the link.
- Wait for data to populate, then check Reports → Search Console for Queries and Google organic search traffic.
- Validate landing pages appear, then note the report names you’ll blend later.
If Queries and Landing pages show up here, your SEO timeline will have a real “before” baseline.
Harden GA4 tracking
Before you chart an SEO timeline, make sure GA4 is recording the signals you’ll trust later. Get conversions, channel rules, and landing page dimensions clean first. Otherwise your dashboard will look precise and still be wrong.
Define conversions
Pick conversion events that reflect real SEO value, then keep the list tight.
- List your primary SEO outcomes, like leads, sign-ups, or purchases.
- Map each outcome to a GA4 event you already collect.
- Mark only those key events as Conversions in GA4.
- Audit for duplicates, like two events for one submit.
- Document event names and owners in one shared place.
Treat conversions like a contract, not a wish list.
Channel consistency
Your SEO dashboard depends on “Organic Search” meaning the same thing every month. Check GA4’s Default Channel Grouping first, then decide if you need custom rules.
GA4 usually classifies Organic Search from source, medium, and known search engines. Edge cases show up fast, like organic traffic routed through redirects, mis-tagged UTMs, or partner domains that look like referrals. When you see misclassification, fix the inputs or create a custom channel group rule that you can explain.
If Organic Search is unstable, your trendline becomes a story about tagging, not SEO.
Landing page hygiene
Landing pages are where SEO timelines either sing or implode. Normalize URL variants so one page doesn’t become five lines.
- Decide your canonical view: path only, or path plus key parameters.
- Use the built-in Landing page dimension for path-based reporting.
- Create a derived dimension for normalized URLs when parameters matter.
- Filter obvious junk parameters in reports, not in data collection.
- Group templates with Content Grouping when page-level is too granular.
Clean landing pages turn “noise over time” into “signal you can act on.”
Bot and spam checks
Do a fast contamination scan before you trust any spike. You’re looking for patterns that humans don’t create.
- Sudden sessions spike with near-zero engagement.
- New referrals with weird domains and high volume.
- Self-referrals from your own payment or app domains.
- Organic traffic landing on nonsense parameter URLs.
- Conversions firing without matching user paths.
Fix self-referrals with cross-domain settings and referral exclusions, then revisit your tags.
Choose dashboard tool
Pick your dashboard home before you design any charts. The tool decides your time-series control, who can see it, and how painful updates feel.
Use this comparison to choose between GA4 Explorations and Looker Studio—and keep in mind what you’ll be reporting on each week. If your workflow includes publishing SEO content at a steady cadence (for example, with a platform like Skribra that outputs SEO-optimized posts complete with keywords and meta descriptions), you’ll want a dashboard that makes it easy to monitor organic lift and tie it back to content updates without constant rebuilds.
| Need | GA4 Explorations | Looker Studio | Best for |
|---|---|---|---|
| Time-series control | Limited granularity | Strong chart controls | Trend storytelling |
| Sharing | Restricted access | Easy sharing links | Wider stakeholders |
| Blending | Minimal blending | Multiple data sources | SEO + GSC views |
| Maintenance | Per-user tweaks | Centralized edits | Ongoing operations |
Choose the tool your least-technical stakeholder can still use weekly, without you.
Create timeline dataset
Your dashboard fails when each chart uses a different definition of “a session” or “a conversion.” Build a single time-series dataset first, then point every view at it.
Core fields
Pick a shared grain and a shared set of dimensions, so comparisons stay valid.
- Date (day/week/month)
- Sessions, Users
- Engaged sessions, Engagement rate
- Conversions, Revenue or value
- Landing page, Device, Country, Default channel group
When every chart uses these fields, debates shift from math to decisions.
BigQuery export
Use BigQuery when you need joins, custom attribution logic, or longer history than the UI makes pleasant.
- Link GA4 to BigQuery in Admin.
- Choose a project and dataset location.
- Enable daily export tables.
- Confirm table naming and partitioning by date.
- Document what lives in GA4 versus BigQuery.
If you’re stitching Search Console, CRM, or multiple properties, BigQuery stops being “nice to have.”
Calculated metrics
Define calculations once, then reuse them everywhere. Otherwise, every chart becomes an argument about the formula.
Conversion rate: conversions divided by sessions or users, chosen once. Engagement rate: engaged sessions divided by sessions. Organic share: organic sessions divided by all sessions. Landing-page contribution: landing-page sessions or conversions divided by totals.
Write the definitions down in the dashboard, not in someone’s memory.
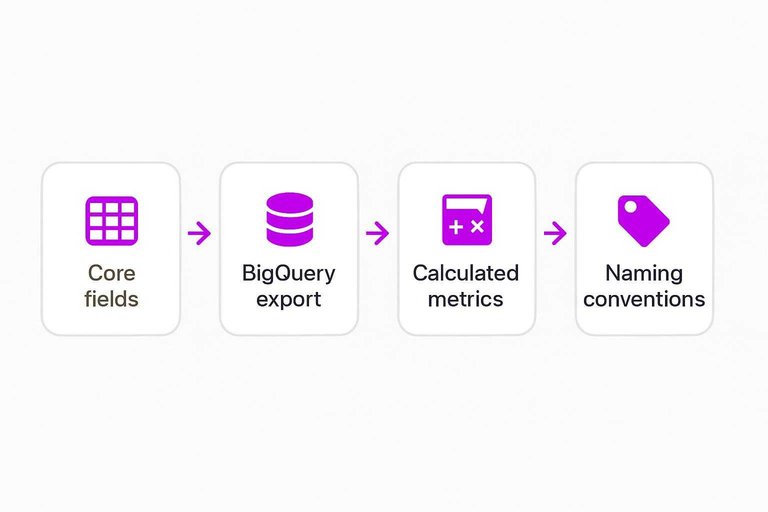
Naming conventions
Names are part of the dataset. If labels drift, the dashboard becomes a glossary nobody trusts.
- Standardize event names and parameters
- Freeze page group labels and rules
- Use consistent channel naming in charts
- Prefix chart titles with metric + scope
Clean names reduce handoffs, because interpretation becomes automatic.
Build in Looker
You’re building a timeline dashboard for one job: make SEO changes visible over time. Keep it boring and consistent, so every spike has a clear explanation path.
Connect data sources
Start by wiring the sources, or every chart becomes a debate. The goal is one calendar, one timezone, and matching date grains.
- Add the GA4 connector and select your property.
- Optionally add BigQuery, if you need raw events or longer retention.
- Add the Google Search Console connector for queries and pages.
- Set date fields to the same type and confirm timezone alignment.
Timezone drift creates fake trends, so fix it before you trust anything.
Global controls
Global controls turn a dashboard into a tool. They also prevent every stakeholder from slicing differently.
- Add a date range control with a sane default.
- Add a device filter using GA4 device category.
- Add a country filter using GA4 country.
- Add a landing-page group filter from your grouping field.
- Enable cross-filtering only where it won’t break blends.
If filters don’t behave predictably, people stop believing the charts.
Core timeline charts
Timeline charts are your backbone view. You want a fast read, plus a quick “is this better than last period?” check.
- Create a time series for Organic Sessions.
- Create a time series for Conversions from organic traffic.
- Create a time series for Conversion Rate, using a calculated field.
- Create a time series for an engagement metric you trust in GA4.
- Add a previous period comparison to each chart.
When these four move together, you’re seeing user behavior, not just measurement noise.
Landing page view
A landing page table answers “where did it come from?” fast. Make it sortable, and make the drilldown obvious.
| Landing page | Organic sessions | Conversions | Trend |
|---|---|---|---|
| Page group | Sessions | Conversions | Sparkline |
| URL | Sessions | Conversions | Sparkline |
| Template | Sessions | Conversions | Sparkline |
| Category | Sessions | Conversions | Sparkline |
If you can’t click from trend to URL, you can’t debug the story.
Query and intent view
Queries explain demand; landing pages explain fulfillment. Blend GSC queries with GA4 landing pages when you can, and keep the join logic explicit.
Use a view that shows GSC impressions, clicks, CTR, and average position beside GA4 outcomes like organic sessions and conversions. When blending is messy, show the two tables side by side and align them by landing page or page group.
That’s where you spot the real gap: ranking for one intent, converting on another.
Launch the dashboard, then make it a habit
- Validate the plumbing: confirm Search Console is linked, conversions fire as expected, channels look consistent, and landing-page paths are clean.
- Lock the dataset contract: finalize core fields, naming conventions, and calculated metrics so charts don’t change meaning over time.
- Publish a v1 Looker dashboard: add global date/device controls, the core timeline charts, plus landing-page and query/intent views.
- Set an operating rhythm: review weekly, annotate notable SEO events (releases, content updates, outages), and iterate only after you spot a reporting blind spot.
Frequently Asked Questions
- What SEO times should I track in GA4 to understand when rankings changes turn into traffic and conversions?
- Track dates for content updates, technical releases, and link campaigns alongside GA4 organic sessions, landing-page conversions, and (via Search Console) impressions/clicks so you can see the lag from visibility to visits to outcomes.
- How do I annotate SEO times in GA4 and Looker Studio if GA4 doesn’t support robust notes?
- Use an external notes source (like a Google Sheet or database table) with a date field and event type, then blend it into Looker Studio so every spike or drop can be tied to a specific SEO change.
- Can I build an SEO timeline dashboard without BigQuery, or do I need it for accurate seo times reporting?
- You can do it without BigQuery if GA4 and Search Console reports cover your needs, but BigQuery helps when you need custom grains, longer retention, or consistent definitions across multiple properties.
- How do I measure whether my SEO times dashboard is working correctly after I publish changes?
- Validate that the same landing pages and date ranges reconcile across GA4 and Search Console, and sanity-check key totals (organic sessions, conversions, GSC clicks) after filters/blends to catch mismatched joins or broken dimensions.
- What can I use to keep consistent SEO times for content publishing and tie them to GA4 performance?
- A content system that outputs publish dates and URLs consistently makes timeline analysis easier; for example, Skribra can help maintain a steady publishing cadence and provide structured metadata you can reference in your notes dataset.
Turn SEO Timelines Into Output
A GA4 SEO timeline dashboard is only useful if you can consistently tie content and technical changes to measurable movement over time.
Skribra keeps your timeline full of publish-ready, SEO-optimized articles you can ship on schedule—plus WordPress publishing, images, and backlinks—so your dashboard reflects real execution. Start with the 3-Day Free Trial.
Written by
Skribra
This article was crafted with AI-powered content generation. Skribra creates SEO-optimized articles that rank.
Share: