June 7, 2026
·
16 min read
SEO Tracking: Everything Marketers Need to Measure
A pillar guide to SEO tracking that helps marketers measure what matters and act on it—build a tracking map, choose the right KPIs, connect data sources (GSC, analytics, ranks, crawls/logs, CRM), and set up segmentation, content scorecards, and technical monitoring that turn data into decisions.
If your SEO “reporting” is a spreadsheet of keywords and a traffic line chart, you’re not really tracking—you’re watching. That’s how teams miss CTR problems, indexation issues, and content decay until revenue feels it.
This guide gives you a complete measurement system: what to track (and why), which KPIs actually signal progress, how to stitch together Search Console, analytics, rank tools, crawls/logs, and CRM data, and how to segment results so you can spot what’s working, what’s broken, and what to do next.
SEO Tracking Map
SEO tracking is the system you use to observe SEO inputs, outputs, and business outcomes over time. It matters because SEO changes are slow, noisy, and easy to misread without a consistent measurement map.
Think in connected layers, not isolated metrics. Visibility creates opportunity, behavior signals intent, and conversions turn intent into money.
What tracking means
SEO tracking captures signals on a schedule, so you can spot change and explain it. Reporting packages those signals for sharing. Analysis decides what the change likely means and what you do next.
Leading indicators move early and predict direction, like impressions, ranking distribution, and crawl health. Lagging indicators confirm impact later, like signups, pipeline, and revenue.
Use leading indicators to steer weekly. Use lagging indicators to judge whether the steering worked.
Measurement layers
You need a funnel view, because each layer constrains the next.
- Crawl and index: pages discovered, rendered, and eligible to rank
- Rankings and visibility: where you appear and how often you’re seen
- Traffic: sessions from search and landing page entry points
- Engagement: behavior that shows fit, like depth and return visits
- Conversions and revenue: leads, sales, and value per visit
A drop in revenue can start as a crawl issue. Trace up the stack before you blame the content.
Attribution reality check
SEO rarely gets a clean, single-touch path from query to purchase. People compare, return later, click ads, read email, and convert on another device.
Offline effects and seasonality distort the story too, especially for branded demand. A promotion, a product change, or a sales push can move “SEO revenue” without any ranking change.
Aim for directional proof with consistent definitions, plus a few tight experiments. Perfect attribution is optional; a reliable decision loop is not.
KPIs That Matter
SEO KPIs only matter when they change a decision. Tie each metric to an owner and a lever, or it becomes dashboard decor.
Use goals as the backbone. Visibility tells you if you can compete, traffic shows if you earn clicks, value proves business impact, and diagnostics keep the machine running.
Visibility KPIs
Visibility metrics predict future traffic. They also expose whether your content matches how Google frames the query.
- Impressions, split by branded vs non-branded queries
- Average position, tracked on a stable keyword set
- Share of voice across your tracked keyword cluster
- SERP feature ownership, by feature type
- Keyword set hygiene: adds, drops, intent shifts
If you cannot name the content action each metric triggers, you are tracking vanity.
Traffic KPIs
Traffic KPIs tell you where SEO is earning actual visits. They also surface weak pages that rank but do not convert.
Track organic sessions and users at the landing-page level, not just sitewide totals. Split new vs returning users and segment by geo and device to catch mismatched intent or performance bottlenecks.
Add anomaly flags for sudden drops, tracking changes, and template releases. Your fastest wins often start as “weird” before they become “bad.”
Value KPIs
Value KPIs keep SEO honest. They connect rankings to pipeline, revenue, or whatever your business actually optimizes.
- Primary conversions from organic landing pages
- Assisted conversions across multi-touch journeys
- Lead quality proxies: stage, fit, sales acceptance
- LTV/CAC context to weight keywords and pages
- Revenue attribution: first-touch, last-touch, multi-touch
If SEO cannot be compared to other channels on value, budget decisions get political fast.
Diagnostic KPIs
Diagnostic KPIs shorten the time from “traffic dipped” to “here’s why.” They turn vague SEO anxiety into a clear fix list.
Watch crawl errors and index coverage to catch blocked templates, canonical mistakes, and accidental noindex. Track Core Web Vitals to spot UX regressions, then pair that with internal link depth to see whether important pages are reachable.
Add content decay indicators like slipping clicks on once-stable URLs. When decay shows up early, a refresh beats a rebuild.
Data Sources Stack
Your SEO numbers live in different systems, built for different jobs. Expect overlap, gaps, and mismatches, because each tool defines “truth” differently.
Use each platform for what it measures best, then reconcile by logic. Not by forcing totals to match. This is also why it helps when your content workflow standardizes the basics (consistent on-page structure, metadata, and publishing cadence), so the inputs you’re measuring are less variable—something platforms like Skribra are designed to keep steady. If you’re building that discipline from scratch, a practical SEO guide for content teams can help set the baseline.
Subsections: [
{
“subheading”: “Search Console”,
“content”: “Search Console is your view of how Google surfaces your pages, not what users do after. It reliably shows queries and pages tied to impressions and clicks, plus indexing and coverage signals that explain visibility limits.\n\nUse filters to isolate a single country, device, or search type before you compare periods. Compare like with like, and treat big query swings as hypotheses to validate elsewhere.\n\nIf Search Console moves and Analytics doesn’t, you may be seeing SERP change, not on-site change. And when you’re publishing at scale, make sure each new page ships with clean titles, meta descriptions, and formatting—otherwise you’ll spend time debugging “indexing problems” that are really just inconsistent page hygiene.”
},
{
“subheading”: “Analytics platform”,
“content”: “Analytics tells you what happened on your site, based on your tagging and attribution rules. It reliably measures sessions, events, conversions, and engagement, but only within your tracking coverage.\n\nChannel definitions vary by platform and configuration, so “Organic Search” is a rule-set, not a law of nature. Consent modes, ad blockers, cross-domain breaks, and sampling can all bend totals and paths.\n\nWhen you audit SEO performance, audit your measurement plumbing first. Then sanity-check that your publishing process isn’t introducing hidden variance (like missing metadata, inconsistent internal linking patterns, or irregular posting schedules) that can muddy trendlines.”
},
{
“subheading”: “Rank tracking tools”,
“content”: “Rank trackers help when you need consistent monitoring outside your own site data. They are best for trend detection, page-to-keyword mapping, and catching sudden drops.\n\n- Monitor priority keywords at a fixed cadence\n- Choose locations and devices that match your buyers\n- Expect personalization and SERP features to shift results\n- Map each keyword to one target page\n- Track clusters, not single terms\n\nUse rank as an alert system, then diagnose with Search Console and crawls. This gets easier when each target page is produced to a repeatable template (keyword focus, headings, metadata), so you can interpret rank shifts as market or technical changes—not just content inconsistency. If you’re evaluating tooling in this category, see ranking platform basics for marketers.”
},
{
“subheading”: “Crawl and logs”,
“content”: “Crawlers show what a bot could discover from links and sitemaps, given your current architecture. Server logs show what bots and users actually requested, which is where crawl budget issues stop being theoretical.\n\nUse crawls to find orphan pages, redirect chains, thin templates, and broken internal paths. Use logs to spot wasted bot hits on parameters, inconsistent status codes, and important pages rarely crawled.\n\nIf you want faster indexing and steadier rankings, fix crawl paths before you write more pages. If you are writing more pages, keep the output standardized—consistent formatting, sensible image handling, and complete metadata reduce the chance that new URLs become crawl clutter instead of indexable assets.”
},
{
“subheading”: “CRM and revenue data”,
“content”: “CRM data is where SEO stops being traffic and starts being pipeline. It can connect landing pages and intent themes to leads, opportunities, and retained customers.\n\n- Capture first landing page and source on lead creation\n- Persist UTM and referrer fields across handoffs\n- De-dupe contacts by email and account rules\n- Track lifecycle stage changes with timestamps\n- Report revenue by landing page theme\n\nIf attribution is messy, treat the CRM as the system of record and tune everything upstream to match it. That includes aligning content themes to the intent you actually sell—when your content engine (whether in-house or via a platform like Skribra) consistently produces pages mapped to those themes, revenue reporting becomes far more actionable.\n\n \n\n”
\n\n”
}
]
Tracking Setup Blueprint
Consistent SEO measurement is a systems problem, not a reporting problem. You need one shared model for KPIs, events, and properties, or every team ships “results” that don’t match.
KPI-to-event mapping
Start with business outcomes, then work backward into trackable behaviors. Otherwise you’ll optimize for what’s easy to measure, not what matters.
- Write 3–5 SEO KPIs tied to revenue, pipeline, or retention.
- Define the event that proves each KPI happened.
- Add parameters for source, content, and intent.
- Assign an owner and a weekly or monthly review cadence.
- Document edge cases, like logged-in users and cross-domain flows.
When every KPI has an owner and an event, debates turn into fixes.
Analytics configuration
Configure analytics like a product surface, not a black box. Precision here prevents months of “why doesn’t this match?” later.
- Implement events and conversions with a single naming convention.
- Standardize channel grouping so SEO splits aren’t arbitrary.
- Apply filters carefully, and keep a raw view or export.
- Set cross-domain measurement for every linked conversion path.
- Separate prod and staging, and label environments clearly.
If your setup can’t survive a new domain or campaign, it isn’t a setup yet.
Search Console configuration
Verify the right properties before you trust any query or page report. Use a Domain property when you need the full picture across subdomains and protocols, and a URL-prefix property when you need tighter control and targeted validation.
Submit XML sitemaps for every indexable section you care about, and keep them clean of redirects and canonicals-to-other-URLs. Treat canonicalization as a tracking dependency: if canonicals point sideways, your performance data will, too. For sitemap implementation details, follow Google’s guidance to build and submit a sitemap.
Dashboards and alerts
Dashboards should match decisions, not curiosity. Build one view for leadership and one for operators, then wire alerts to the few things that break quietly—using resources to simplify SEO workflows where they help reduce manual reporting and alert fatigue.
- Exec dashboard: trends, outcomes, risk flags
- Practitioner dashboard: queries, pages, segments, annotations
- Traffic alerts: sudden drops by landing page group
- Conversion alerts: rate shifts by device or locale
- Coverage alerts: spikes in excluded or error states
Alerts are your early-warning system, not your post-mortem tool.
Segmentation That Reveals
Averages are soothing. They are also how SEO problems hide in plain sight.
Segmenting your data turns “traffic changed” into “this changed for this audience on this set of pages.” That’s how you diagnose causes, prioritize fixes, and report impact without spinning a story.
Brand vs non-brand
Brand queries behave like navigation. Non-brand queries behave like shopping.
When brand demand spikes, your dashboards look “healthier” even if rankings slip elsewhere. A PR hit, a campaign, or offline buzz can lift branded clicks and mask non-brand decay.
Report them separately, then add a third view for total search demand without double counting.
Example reporting structure:
- Brand: queries containing your brand variants
- Non-brand: everything else
- Total: brand + non-brand, with overlaps resolved by a single query rule
Treat brand as a demand signal and non-brand as an acquisition signal. Mixing them turns clarity into noise.
Page-type cohorts
Templates create patterns. Grouping by page type makes those patterns obvious fast.
- Blog posts: informational intent, freshness sensitivity
- Category pages: faceted navigation, internal link leverage
- Product pages: schema, availability, reviews
- Local pages: proximity, NAP consistency
- Docs pages: long-tail, indexation reliability
When one cohort drops together, you’re usually looking at a shared constraint. Fix the template, not the symptom.
Audience and device
Your “same keyword” is not the same result. Location and device quietly rewrite the SERP.
Mobile results often compress blue links with packs, carousels, and rich snippets. Desktop can look stable while mobile loses clicks from layout changes.
Segment by country, device, and language before you call a win or a loss.
Useful cuts:
- Country: separate search demand and legal or cultural constraints
- Device: mobile vs desktop vs tablet in Search Console
- Language: hreflang groups and translated intent differences
International SEO breaks when assumptions travel. Segment first, then interpret.
Time comparisons
Use multiple time windows to avoid mistaking seasonality for performance.
- Check WoW for sudden shocks and tracking issues.
- Check MoM for sustained movement beyond weekly noise.
- Check YoY to control for seasonality and demand cycles.
- Annotate releases, migrations, and major content pushes on the trendline.
- Add known algorithm-update windows as separate annotations, not excuses.
If you can’t tie a change to a window and an event, you don’t have a diagnosis yet.
SERP Performance Tracking
Rankings don’t tell you what the results page did to your clicks. SERP tracking connects query intent, snippet presentation, and actual outcomes, so you can change what users see.
CTR diagnostics
CTR is only useful when you control for intent and SERP context. Otherwise, you’ll “fix” the wrong page.
Compare CTR in clean buckets:
- Query intent: navigational, informational, commercial, transactional
- Position buckets: 1, 2–3, 4–6, 7–10
- Snippet type: standard, sitelinks, FAQ, review stars, rich result
- Device: mobile vs desktop
Look for patterns that create testing candidates:
- High rank, low CTR: title promise mismatch or weak differentiation
- Low rank, high CTR: message resonates, but visibility is limiting
- CTR drops after SERP change: new features stealing attention
- CTR varies by intent: wrong landing page for the query’s job
Run title and meta tests where you can change perception fast:
- Add specificity: audience, use case, or constraint
- Add proof: “template”, “checklist”, “examples” when true
- Remove fluff: generic adjectives that waste pixels
Treat CTR as a SERP negotiation, not a content grade. If you need a reference for definitions and nuances like average position, review Search Console’s explainer on impressions, position, and clicks.
Feature ownership
SERP features can make you look bigger than your rank. They can also erase you from attention.
Track these features and decide your stance:
- Featured snippets: own it or avoid zero-click traps
- People Also Ask: seed answers and win follow-ups
- Local pack: push listings, not blog posts
- Video/image: match intent with media formats
- Shopping: compete on feed quality, not prose
Pick “optimize” when the feature drives qualified clicks. Pick “avoid” when it satisfies the query without a visit.
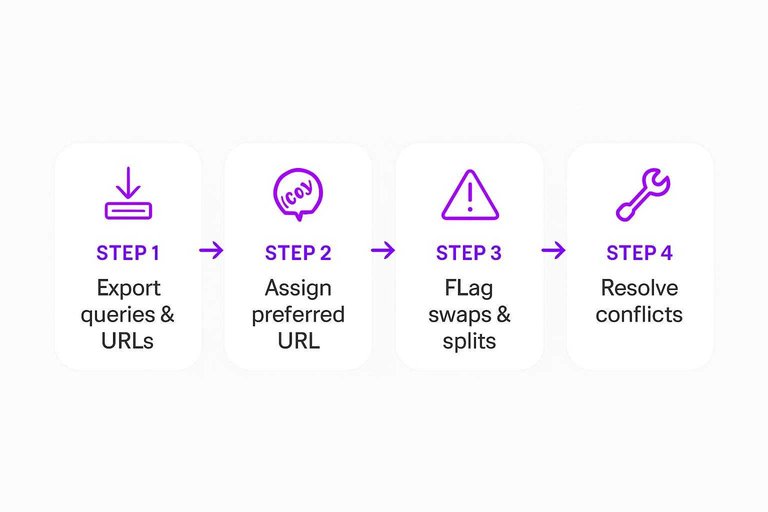
Keyword-to-page mapping
Cannibalization is usually a mapping problem, not a content problem. Fix ownership before you write anything.
- Export queries and ranking URLs for each topic cluster.
- Assign one preferred URL per primary intent and query family.
- Flag swaps, split rankings, and multiple URLs in top results.
- Resolve conflicts with consolidation, canonicals, redirects, or internal link re-pointing.
- Monitor weekly for new pages stealing the query by accident.
When a query “belongs” to a page, your optimizations compound instead of collide.
Content Measurement System
You can’t manage content with one-off reports. You need a system that shows performance over time, catches decay early, and tells you what to fix next.
Treat every URL like an asset with a job. Some should be expanded, some should be maintained, and some should be retired.
Landing page scorecard
Use one scorecard to separate “more potential” from “something broke.” Keep it consistent so trends are obvious.
| Segment | Impressions/Clicks/CTR | Conversions/Assisted value | Internal links |
|---|---|---|---|
| Opportunity | High / low / low | Stable or rising | Few or weak |
| Underperforming | Stable / down / down | Down or flat | Normal or strong |
| Saturated | High / stable / stable | Stable | Strong |
| Mismatched intent | High / low / mixed | Low | Any |
Once you label the page, the next action is usually obvious.
Content lifecycle
Content moves through predictable phases, even when your tracking looks messy. Your job is to match refresh decisions to why the page changed.
Launch: indexing, first rankings, and early query discovery.
Growth: more queries, better positions, and compounding internal links.
Plateau: stable demand, stable ranks, and diminishing returns.
Decay: drops from intent shifts, competitor gains, or SERP layout changes.
Refresh triggers should map to the cause, not the symptom.
Topic and cluster impact
Single pages lie. Clusters tell you whether your topical bet is working.
- Track grouped queries by intent, not just keyword strings.
- Compare page cohorts: new, refreshed, and legacy URLs.
- Measure internal link changes against rank distribution shifts.
- Watch non-branded impressions across the whole cluster.
- Monitor cannibalization: two pages trading the same clicks.
If the cluster rises together, you built authority, not a lucky URL.
Update evaluation
Updates need the same discipline as experiments. Otherwise, you’ll “feel” results that aren’t real.
- Capture a pre-period baseline and define the post-period window.
- Annotate the exact changes, including internal links and titles.
- Control for seasonality using comparable pages or query groups.
- Check channel mix shifts so SEO doesn’t get blamed or credited.
- Set success thresholds and rollback triggers before you ship.
If you can’t define rollback, you’re not testing. You’re hoping.
Technical SEO Monitoring
Technical SEO tracking only helps when it triggers a decision. You want a short list of checks, a cadence, and clear tripwires that justify investigation.
Crawl and index health
Crawl and index problems hide in small deltas until they become a ranking event. Watch the few signals that reveal coverage drift, duplication, and wasted crawl.
- Track index coverage deltas by folder and template
- Monitor crawl errors by type and spike patterns
- Flag redirect chains over two hops
- Detect canonical conflicts across duplicate clusters
- Reconcile sitemap URLs against indexable URLs
Treat “sudden change” as a release candidate until proven otherwise.
Site performance signals
Performance monitoring works best when you can blame a template, not a vague “speed issue.” Tie metrics to deployments, layouts, and third-party scripts so fixes stay surgical.
Track Core Web Vitals, TTFB, and key render blockers by template group. Set alerts on sharp regressions, then diff recent releases, tag manager changes, and ad or analytics updates.
If you can’t map a regression to a code path, you’ll keep shipping the same bug.
Structured data checks
Structured data breaks quietly, then your rich results vanish. Build a routine that catches validation failures and eligibility changes before traffic does.
- Inventory schema types by template and page cohort.
- Validate samples weekly with rich results and schema testing tools.
- Triage errors by root cause, not by URL count.
- Re-test after releases that touch templates or content fields.
- Spot-check SERPs for rich result appearance and eligibility shifts.
When schema fails, the fix is usually upstream in templates or fields, not in one page.
Internal links and depth
Internal link monitoring is how you prevent “good pages” from becoming invisible. Group pages into cohorts so you can see whether a template or section is starving the crawl.
Audit orphan pages, link paths, and click depth by template and traffic tier. Watch for navigation changes, faceted URL growth, and repeated “related content” modules that loop link equity.
If important pages need four-plus clicks, you built a maze, not an information architecture.
Turn Tracking Into a Weekly Operating Rhythm
- Pick your North Star KPIs and guardrails: Choose 1–2 primary outcomes (value KPIs) and a small set of visibility/traffic/diagnostic metrics that explain movement.
- Wire the stack end-to-end: Confirm Search Console + analytics + rank tracking + crawl/log signals are connected, and map each KPI to a page, query group, event, or revenue field.
- Segment before you analyze: Review brand vs non-brand, page-type cohorts, device/audience, and time comparisons so you don’t average away the truth.
- Run two loops every week: A performance loop (CTR, features, keyword-to-page fit, top landing pages) and a hygiene loop (crawl/index health, performance signals, structured data, internal links).
- Document decisions, not just numbers: For each change in the dashboard, record the likely driver and the next action (test, refresh, consolidate, fix) so tracking consistently produces priorities.
Frequently Asked Questions
- How do I track SEO impact on leads and revenue (not just traffic)?
- Connect Google Search Console landing pages to GA4 conversions and your CRM pipeline so each organic session can be tied to a lead stage and revenue outcome. Use consistent UTM governance for non-SEO campaigns so “organic” attribution stays clean.
- Why don’t my SEO tracking numbers match between Google Search Console, GA4, and my rank tracker?
- They measure different things: Search Console reports search impressions/clicks, GA4 reports on-site sessions and events, and rank trackers estimate positions from their own locations and devices. Treat one tool as the source of truth per metric, then reconcile directionally instead of forcing exact matches.
- What’s the best way to track SEO for multiple domains, subdomains, or international sites?
- Use separate GA4 data streams (or properties where needed) and ensure each site has its own Search Console property (Domain property when possible), then standardize naming for content types, templates, and markets. Create a shared reporting layer (Looker Studio, BigQuery, or a BI tool) so rollups don’t hide site-specific issues.
- How do I track SEO performance for brand vs non-brand queries?
- Create brand/non-brand query groups in Search Console (via regex filters or exports) and report them separately for clicks, impressions, and CTR. This prevents brand demand from masking whether your non-brand content is actually growing reach.
- Can I automate SEO tracking reports without building a custom dashboard from scratch?
- Yes—start with Looker Studio templates for GA4 and Search Console, then automate exports via the Search Console API or scheduled BigQuery pulls for consistent weekly reporting. If your bottleneck is producing and publishing SEO content consistently alongside tracking, a tool like Skribra can help keep a steady content cadence while you measure results.
Turn Tracking Into Growth
Once your SEO tracking map and KPIs are in place, the next challenge is producing consistent, measurable content that moves those numbers week after week.
Skribra generates and publishes SEO-optimized articles built for SERP performance and content measurement—so your tracking setup has something new to validate. Start with the 3-Day Free Trial.
Written by
Skribra
This article was crafted with AI-powered content generation. Skribra creates SEO-optimized articles that rank.
Share: