August 22, 2026
·
Updated September 6, 2026
·
10 min read
Google Search Pages: 9 SERP Metrics to Track in 2026
A case-study-style guide to evaluating SERP performance in 2026—validate metric viability, avoid common measurement traps, and operationalize four high-signal metrics (impression share, feature ownership, rank distribution, and CTR by layout) using segmentation and confidence checks.

If you’re still judging SEO by “average position” and a single CTR line, 2026 SERPs will keep tricking you. Layouts shift, features steal attention, and rankings can look stable while actual visibility quietly moves elsewhere.
This case study walks you through a more reliable way to evaluate SERP performance: the viability questions to ask before you trust any metric, the measurement principles that keep comparisons honest, and four metrics that connect visibility to decisions—so your next optimizations target what users actually see and click.
Why SERP metrics
SERPs in 2026 are less stable and less click-centric. AI Overviews, heavy modules, and personalization can change what “ranking” even buys you.
You evaluate SERP metrics for three goals: visibility, intent fit, and business impact. If a metric can’t inform one of those, it’s noise.
What changed in 2026
The modern results page is a product, not a list. It answers, refines, and routes users before they ever consider your page.
AI answers, forums, video blocks, and shopping modules now compete with classic blue links. Query refinement paths also split intent mid-journey.
Treat every keyword like a layout problem, not a position problem.
Viability questions
You’re not picking keywords. You’re picking fights.
- Can this SERP still send meaningful clicks?
- Does the intent match your offer and content?
- Is the lift worth the effort and time?
- Can you defend the spot against bigger brands?
- Can you measure impact with confidence?
If you can’t answer two or more, don’t “optimize.” Re-scope.
Measurement principles
Attribution is fuzzier because the SERP does more of the work. You’ll often see influence without a clean click path.
Triangulate with Google Search Console for queries and appearance, analytics for on-site outcomes, rank tracking for movement, and SERP capture for what actually showed. One source lies by omission.
When tools disagree, trust the screenshot and the query-level clicks first.
Common metric traps
Bad metrics feel precise. That’s why they spread.
- Averaging ranks across wildly different queries
- Ignoring SERP features that steal attention
- Treating last-click as the whole journey
- Mixing branded and non-branded performance
Fix the measurement model first. Then argue about content.
The nine metrics
SERP metrics only help when they ladder cleanly from exposure to action. Think: you appear, you earn attention, you win a click, you keep the user, you drive the outcome. Benchmarks age fast in 2026, but interpretation holds up.
Visibility vs value
Visibility metrics tell you if Google can even “see” you for a query set. Value metrics tell you whether that visibility produces business results.
A #2 rank with a crowded SERP can be noise, while a #6 rank on a high-intent query can still drive leads. Treat presence and rank as leading indicators, then validate with clicks and conversions before you celebrate or panic.
Optimize for outcomes, but diagnose with visibility.
Metric selection map
Pick metrics in the same order you make decisions, not the order your tools display them.
- Define the query set you actually want to win.
- Segment queries by intent: informational, commercial, navigational.
- Map SERP feature risk: ads, AI answers, local packs, videos.
- Choose one primary metric per intent segment.
- Add guardrails: tracking coverage, crawl health, conversion integrity.
If you want a broader framework for choosing and interpreting SEO performance signals, see this SEO guide for measuring results.
If a metric can’t trigger a specific action, it’s decoration.
Segmenting the dataset
Segments stop averages from lying to you. Cut the data where behavior and SERP layouts actually change.
- Device: mobile vs desktop behavior
- Geography: country, city, or radius
- New vs returning: first click vs repeat visits
- Branded vs non-branded: demand capture vs demand creation
- Topic clusters: pages competing together
If the story changes by segment, you’re looking at multiple strategies.
Confidence checks
SERP movement is easy to misread because the sample shifts under you. Low impressions, thin conversion counts, or a short window can turn normal variance into a “trend.”
Seasonality also fakes breakthroughs and failures, especially around launches, holidays, and news cycles. Keep a change log for site edits, tracking changes, and SERP feature rollouts, so you can explain spikes without guessing.
If you can’t explain the change, don’t optimize for it yet.
1) Impression share
Impression share is your visibility footprint, not your traffic report. Measure it by query cluster so you can spot gaps that are opportunity, not noise.
Rising impressions can be bad news when visibility shifts toward low-intent queries. That’s when Google is showing you more, but to the wrong people—often a sign your content breadth is expanding faster than your intent alignment.
How to measure
Use Google Search Console so you can track visibility by intent group, not by random keyword lists.
Keep the views consistent, or your trend becomes fiction.
- Export queries and group them into intent-based clusters.
- Filter by page type to keep comparisons fair.
- Export impressions over time for each cluster.
- Annotate SERP layout and algorithm changes on the timeline.
If you publish frequently (for example, via a system like Skribra that keeps formatting and on-page SEO consistent), those annotations become even more important—otherwise you’ll mistake publishing volume for real intent gains.
Treat annotations like unit tests for your conclusions.

How to interpret
Impressions only matter in context: clicks, intent, and which page earned the view.
Watch for patterns that indicate misalignment, not growth.
Growing impressions with flat clicks often signals weaker snippet fit or tougher SERP features. Impressions shifting into low-intent clusters is usually a relevance leak, not a win. Cannibalization shows up when multiple pages trade impressions for the same cluster without improving total clicks.
This is also where consistent metadata and keyword targeting help: when titles/meta descriptions vary wildly across similar pages, it’s harder to tell whether the issue is intent, snippets, or simple inconsistency in how pages were generated and published.
If impressions rise while outcomes don’t, Google may be testing you—not rewarding you.
Decision use
Turn impression share gaps into actions tied to intent and business value.
Pick one move per cluster, or you’ll create more overlap.
- Refine targeting to match the dominant SERP intent.
- Consolidate overlapping pages that split impressions.
- Expand coverage where high-intent gaps persist (ideally with a repeatable process for SEO formatting, keyword focus, and publishing cadence).
- Deprioritize topics with weak commercial overlap.
Visibility is only an asset when it compounds into the right clicks.
2) Feature ownership
Feature ownership is your share of the SERP’s attention, not just your rank. In 2026, “being on the page” often means showing up inside modules users never leave.
What to track
Track features the SERP can award, and track your ownership state inside each one.
- AI Overviews: not present → present/no cite → cited → multi-module dominant
- Featured snippets: not present → present/no cite → cited → multi-module dominant
- People Also Ask: not present → present/no cite → cited → multi-module dominant
- Video modules: not present → present/no cite → cited → multi-module dominant
- Local and shopping: not present → present/no cite → cited → multi-module dominant
Ownership is reach plus brand proof, even when clicks stay flat.
How to measure
Measure ownership with repeatable SERP snapshots, not memory or single exports. Use a rank tracker that captures SERP features, plus manual screenshots for your highest-value queries.
Tag each query with the modules present, your state in each module, and the URL shown. Store weekly histories, because layout changes can look like “performance changes” when nothing on your site moved.
When the SERP shifts, your dashboard should show the shift first.
How to interpret
Start with outcomes, then work backward to the feature.
- Compare feature gains or losses to CTR changes by query cluster.
- Check intent fit: informational, navigational, local, or transactional.
- Validate the landing experience matches the module’s promise.
- Review downstream quality: leads, revenue, and return visits.
- Decide: defend the module, or pivot to another feature.
A citation without the right intent match is a visibility win and a business loss.
3) Rank distribution
Rank distribution tells you where you actually live on the SERP, not where your average says you do. Buckets plus volatility reveal which gains are defensible and which are one update away from disappearing.
Stability is a moat. Performance is just a snapshot.
How to measure
Use views that show buckets and movement, not a single blended number.
- Position histogram by bucket (1–3, 4–10, 11–20, 21+)
- Page-level winners and losers by total visibility change
- Variance over time per query cluster
- Share of keywords in each bucket, weekly
- URL churn for top buckets
If you can’t see shape and churn, you can’t manage risk.
How to interpret
Average rank lies when your distribution is lopsided. A few #1s can hide a lot of decay into positions 11–20.
Watch for distribution shifts first, then explain them with volatility. A stable cluster in the top buckets is coverage you can plan around, while spiky movement often signals fragile intent-match or SERP feature dependence.
Defensibility shows up as quiet charts. For how Google defines and reports average position, see the Performance report overview.
Decision use
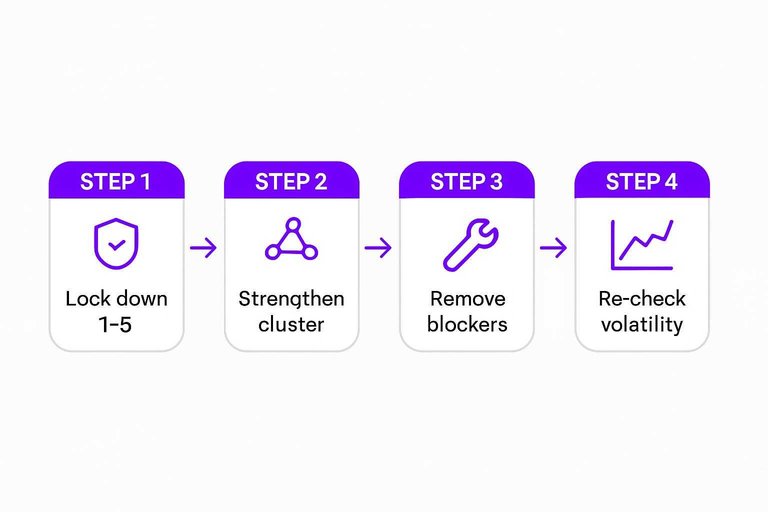
Turn the distribution into a simple operating plan.
- Lock down high-value positions 1–3 with freshness and on-page upkeep.
- Build supporting content that strengthens the cluster, not just one URL.
- Remove technical blockers holding mid-pack queries back.
- Promote the best mid-pack pages with internal links from relevant winners.
- Re-check volatility after changes to confirm you improved stability.
Treat mid-pack as your growth engine, and top spots as assets to defend.
4) CTR by layout
CTR is a reaction to what the results page makes easy, not a purity test of your headline.
On modern Google search pages, “position 12” can mean:
- you’re the first organic result after an AI Overview,
- you’re buried under a stack of modules (ads, shopping, Local Pack, videos, People also ask),
- or you’re technically ranking, but visually invisible on mobile.
Treat layout as the competitor. Your CTR is your market share inside that layout.
If you’re sitting around position ~12 with 0% CTR, don’t assume the title “failed.” Assume one of these is true:
- your snippet isn’t eligible for the layout that’s winning attention,
- your snippet is eligible but not selected (wrong formatting, wrong intent, missing signals), or
- the layout answers the query without requiring a click.
The fix is layout-specific diagnostics first, snippet fixes second.
How to measure
Pull CTR in a way that separates layout effects from content changes, then compare each slice to your own baseline, not a generic benchmark.
- In GSC, open Performance → Search results.
- Add Device filters for Desktop, Mobile, and Tablet.
- Add Query filters by intent buckets you maintain.
- Use Search appearance where available to isolate rich results.
- Compare date ranges against your last stable layout period.
Then add two practical checks that explain “0% at ~12” fast:
-
Check top queries driving the impressions. Export the queries for the page and scan for patterns (local intent, shopping intent, “how-to” intent, comparison intent). A page that’s written like a guide can end up exposed mostly on SERPs dominated by shopping grids or local packs—and the layout mismatch shows up as impressions with no clicks.
-
Do a manual SERP spot-check for your highest-impression queries (on mobile and desktop). You’re not looking for rankings—you’re looking for what’s above you and what your snippet looks like in that context:
-
Is there an AI Overview? If yes, are there citations to sources like yours?
-
Are there ads/shopping blocks pushing organic below the fold?
-
Is there a Local Pack, Videos, Top stories, or People also ask stack?
-
Does your result show sitelinks, image thumbnail, date, or other enhancements—or is it a plain blue link?
If you can’t segment by feature in GSC, use query clusters as your proxy and let the manual spot-check tell you which layout you’re actually competing inside.
How to interpret
Click-through rate shifts often signal a layout/module change, not a copywriting failure. Look for repeatable patterns across many queries.
Common layout-driven CTR patterns (and what they usually mean):
-
CTR collapses on mobile but not desktop: your listing is pushed below the fold by modules. Treat this as a visibility problem (what appears above you) and a snippet enhancement problem (what makes your result stand out when it finally appears).
-
High impressions, near-zero clicks on queries with AI Overviews: the SERP is satisfying intent without a click, or your page isn’t being treated as a cite-worthy source. In that case, your goal isn’t “better titles,” it’s becoming the page that can be referenced or the page that answers the next question the overview creates.
-
CTR is fine on informational queries but dead on commercial ones: you’re showing on SERPs dominated by Shopping/ads/reviews while your page reads like an article. That mismatch is fixable either by retargeting the query set or by reformatting the page to compete for commercial modules.
-
CTR rises when you trigger a rich result, then drops when it disappears: you’re dependent on a module you don’t consistently win. Stabilize the eligibility signals (structured data accuracy, on-page formatting, media) and make the fallback snippet strong enough to survive without the enhancement.
Once you see a pattern, you can stop “fixing titles” and start fixing fit—and only then zoom in on things like SEO titles vs H1 headings when it’s truly a snippet-level issue.
Layout-specific snippet diagnostics and fixes (practical, not theoretical):
-
AI Overviews:
-
Diagnostic: Your page gets impressions on overview-triggering queries, but clicks don’t follow.
-
Fix: Add a clear, early-answer section that can be lifted cleanly (short definition, key steps, bullets), then support it with uniquely useful detail immediately after (examples, edge cases, constraints). Make headings explicit and scannable so Google can understand “what this page is for” fast.
-
People also ask / question stacks:
-
Diagnostic: Queries are phrased as questions, but your intro is generic and your subheads don’t mirror questions.
-
Fix: Turn key subheads into direct questions and answer them in 2–4 sentences before expanding. This improves snippet clarity even if you don’t win a module.
-
Video/image-heavy layouts (often mobile):
-
Diagnostic: The SERP is visually rich; your snippet is plain.
-
Fix: Ensure the page has a strong, descriptive title and meta description that “previews” a concrete takeaway (tool, checklist, template, steps) rather than a promise. If your CMS supports it, make sure the page’s images are relevant and well-described so you’re not invisible when thumbnails appear.
-
Commercial SERPs (ads, shopping, reviews):
-
Diagnostic: Impressions come from “best,” “pricing,” “vs,” “alternative,” “review” queries; CTR is near zero.
-
Fix: Make the snippet match buyer intent: be specific about what’s compared, what’s included, and who it’s for. If the page is informational, consider targeting the follow-up informational query instead of trying to “out-click” shopping grids.
-
Brand vs non-brand inflation/deflation:
-
Diagnostic: CTR looks fine when brand terms appear, dead otherwise.
-
Fix: Evaluate non-brand queries separately and improve the snippet to communicate relevance instantly (exact match to intent, clearer angle, fewer vague adjectives).
Decision use
Use CTR-by-layout to choose the battles that the SERP is actually hosting—and to fix the specific reason you’re getting impressions without clicks.
-
If the page sits around ~12 with 0% CTR: prioritize visibility and eligibility changes before rewriting copy.
-
Win enhancements you can control (clean structure, clear headings, accurate schema where appropriate, media that matches intent).
-
Tighten the snippet so it communicates the page’s “job” in one glance (who it’s for + what it delivers + what’s different).
-
If AI answers dominate the SERP: prioritize content that can be cited (clear definitions, steps, constraints, and unique additions) and/or target follow-up queries that still require a click (implementation, troubleshooting, templates, comparisons).
-
If rich results drive higher CTR: invest in the schema, media, and formatting that wins those modules, then keep the landing page aligned with the promise.
The line you don’t cross is clickbait. Misalignment can lift CTR and still lose the week.
Turn the Metrics Into a Weekly SERP Scorecard
- Start with segmentation: split by query intent, device, brand vs non-brand, and key templates so layout changes don’t blur your signals.
- Build a compact scorecard for each segment using impression share, feature ownership, rank distribution, and CTR by layout—then trend them side by side to separate “visibility” from “value.”
- Add confidence checks: verify tracking consistency, annotate known SERP shifts, and sanity-check anomalies against landing-page and query changes.
- Convert movements into actions: defend segments losing impression share, prioritize features you can realistically own, fix distribution (not just averages), and update pages where layout-specific CTR drops first.
Turn SERP Metrics Into Growth
Tracking impression share, feature ownership, and CTR by layout is useful—but improving them across changing Google search pages takes consistent, scalable execution.
Skribra publishes daily SEO-optimized articles with WordPress integration, auto images, and backlink support to help you win more SERP real estate—start with a 3-Day Free Trial.
Written by
Skribra
This article was crafted with AI-powered content generation. Skribra creates SEO-optimized articles that rank.
Share: