August 13, 2026
·
10 min read
7 Google Search Console Mistakes That Hide Search Data
A practical troubleshooter for when Google Search Console seems to “lose” clicks, queries, or pages—diagnose missing-data symptoms, confirm what’s real vs delayed or sampled, and fix the most common causes: wrong properties, leftover filters, date-range traps, canonical confusion, and indexing blockers.

If Search Console looks emptier than it should, you’re not alone—and it’s rarely “Google just stopped showing data.” Most gaps come from settings, scope mismatches, or signals that prevent Google from attributing impressions and clicks to the pages you expect.
This troubleshooter helps you pinpoint what’s actually missing, verify whether it’s a real loss or a reporting quirk, and run a quick triage to the specific fix. You’ll walk away knowing exactly where to look in GSC—and what to change—to get your search visibility back into view.
What’s Missing, Exactly
In Google Search Console, “missing data” usually means specific rows disappear, not that tracking stops. The symptom depends on the report you’re in, so the fix starts with naming what vanished.
Performance issues show up as absent queries, pages, or countries. Pages can look “missing” because the URL you expect is folded under a different canonical. Coverage/Indexing can look empty because the report scope changed, or because the URL is simply not eligible to be indexed.
Common missing symptoms
Missing data has repeatable patterns, and they point to different causes. Spot the pattern first, then investigate.
- Zero clicks with impressions still present
- Sudden drop on a specific date
- Missing queries you know you rank for
- Missing pages that still get traffic
- Dates don’t match across reports
If you can name the symptom precisely, you can usually skip half the guesswork.
Confirm it’s real
False alarms happen because GSC defaults are easy to forget. Do quick checks before you assume something broke.
- Align date ranges and time zones across tools.
- Clear or review all report filters and comparisons.
- Run a few Incognito searches for known queries and pages.
- Cross-check analytics and server logs for organic landings.
If users still arrive from Google, your “missing” is probably filtering, folding, or delays.
How GSC samples data
GSC Performance data is aggregated, anonymized, and sometimes withheld at the row level. That can hide long-tail queries or low-volume pages without implying a tracking failure.
Some rows collapse into “Other,” some are removed for privacy, and some never meet reporting thresholds. You still get totals, but you lose granularity.
Treat missing rows as a visibility limit, not a measurement bug.
Triage decision tree
You need a fast way to route the symptom to the likely cause. Start with the report, then narrow by what’s missing.
- If totals drop across all views, check data delays and manual filters.
- If only one property looks wrong, check property type and verification.
- If pages are missing, check indexing state and canonical selection.
- If queries are missing, check aggregation limits and country/device filters.
- If Indexing looks fine but Performance is empty, check date range and report scope.
The fastest wins come from fixing setup and scope before you touch the site.
Mistake 1: Wrong Property
Google Search Console only shows data for the property you verified. Pick the wrong one, and entire chunks of your site vanish from reports.
A common trap is mixing up Domain vs URL-prefix properties. Then you chase “missing” clicks that were never in that view.
Fast diagnosis
You can usually confirm a property mismatch in a few minutes. You’re checking whether the URLs you care about even belong to this property.
- Check the property type: Domain or URL-prefix.
- Inspect a “missing” URL and note the canonical and discovered URL.
- Confirm you’re verified for the inspected URL’s host and protocol.
- Compare the affected URLs for the same host and protocol.
- Switch properties and re-check the same URL.
If Inspect URL shows data in another property, you found the leak.
Root cause patterns
Most “empty report” problems come from small URL differences that create big property boundaries. Look for these splits.
- Missing http vs https coverage
- Missing www vs non-www coverage
- Blog on a subdomain
- Country content in subfolders
- Alternate hostname tracked separately
If two URLs look similar but resolve differently, GSC treats them as different worlds.
Fix it properly
Fix the view first, then fix your interpretation of the data. You want one property that matches how Google sees your whole site.
- Add a Domain property for the root domain.
- Verify ownership via DNS, then confirm verification is active.
- Add URL-prefix properties for any critical slices you want isolated.
- Use Performance and URL Inspection from the correct property going forward—if you need a broader refresher, see this practical SEO guide.
- Document which property is your “source of truth.”
Use Domain for coverage, then keep URL-prefix for focus.
Mistake 2: Filters Left On
Filters in Google Search Console are sticky, and they travel with you between views. One leftover chip can quietly remove most rows, then make normal fluctuations look like a ranking problem.
Spot the hidden filters
Filters can hide in plain sight, especially when you bounce between Performance and Pages reports. You want to find every active constraint before you trust the numbers.
- Scan the top bar for filter chips like Query, Page, Country, Device, Search appearance.
- Open Compare and confirm you are not in a filtered comparison mode.
- Click “+ New” and check for any existing includes or excludes.
- Repeat on both Performance and Pages, since filters do not always match.
If you see any chip you did not set today, treat the report as compromised.
High-impact culprits
A few filters are responsible for most “missing data” scares. They remove large chunks while still leaving charts that look believable.
- Regex query filters that exclude most terms
- Page contains rules on a partial URL
- Country locked to a single market
- Device locked to mobile or desktop
- Search type mix-ups like Web vs Discover
One of these is enough to turn a sitewide view into a tiny slice.
Reset and re-check
You need a clean baseline before you troubleshoot anything else. Reset first, then add constraints back with intent.
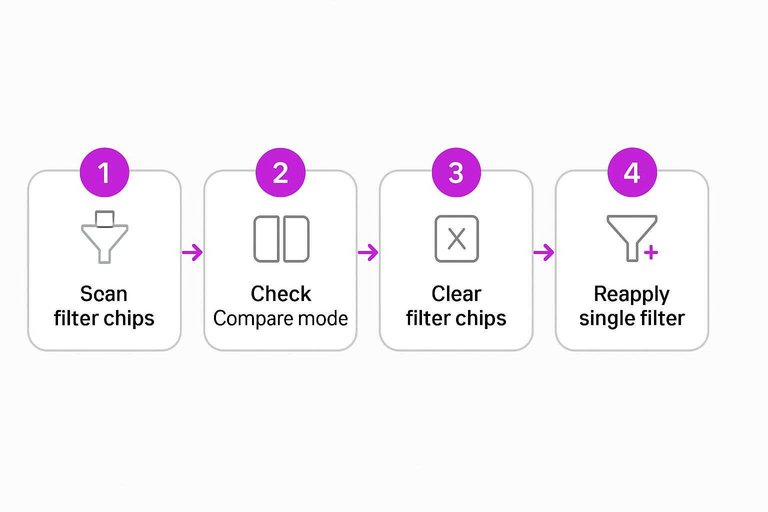
- Clear every filter chip until only the default view remains.
- Set the date range to the maximum available, often 16 months.
- Confirm Search type matches your question, usually Web.
- Note totals for clicks, impressions, and pages in this clean view.
- Reapply a single filter, then watch what drops.
If one filter causes the cliff, you found the “problem” in one click.
Mistake 3: Date Range Traps
Google Search Console data looks precise, but it has sharp edges. Pick the wrong window, and you’ll “debug” a problem that’s just a calendar illusion.
A simple example: you change a title tag today, then panic tomorrow when clicks “drop.” You’re often staring at delayed, partial days and mismatched comparisons. If you’re publishing content frequently (for example, via an automated workflow like Skribra’s WordPress integration), these timing effects can feel even more dramatic because pages are changing more often—making clean, comparable windows even more important.
Recent data delay
The last 1–3 days in Search Console can be incomplete because processing lags behind real time. That lag makes fresh drops look dramatic during troubleshooting, especially when you filter to a page or query.
If you’re auditing a sudden decline, first test whether the “drop” disappears when you exclude the newest days. Many “issues” are just unsettled data.
This matters most on sites with steady publishing cadences (daily posts, frequent updates, or scheduled rollouts), where new URLs and on-page changes can stack up faster than reporting settles.
Treat the most recent days as a moving target, not evidence.
Comparison pitfalls
Comparisons are only useful when the windows behave the same. Small differences can create fake wins or losses.
- Comparing weekdays to weekends, then blaming SEO
- Comparing 7 days to 28 days, then calling it a trend
- Using custom ranges that span major site changes
- Mixing pre- and post-migration periods in one view
Also watch for “hidden” publishing variables: if one window includes a burst of newly published SEO pages (or a new formatting/meta template) and the other doesn’t, you’re comparing different inputs—not just different dates. If the windows don’t match reality, your conclusion won’t either.
Safer time windows
Use time windows that reduce noise before you diagnose or report.
- Exclude the last 2–3 days from both periods.
- Compare equal-length windows, like 28 vs. previous 28.
- Sanity-check with a 90-day view before escalating.
- Recheck after major releases, migrations, or indexing changes.
If you’re running a consistent publishing system—whether that’s a manual editorial calendar or automated daily publishing—align your measurement windows to that cadence so you’re not “discovering” problems that are really just timing.
Make the calendar boring first. Then trust the story.
Mistake 4: Canonical Confusion
Canonical confusion happens when Google chooses a different “main” URL than the one you’re tracking. Your target page can earn visibility, but Google credits impressions and clicks to the selected canonical instead.
Imagine you optimize /pricing, but Google prefers /pricing/ or a parameterized version. GSC makes your work look invisible, even when search demand is there.
Symptoms in reports
Canonical confusion shows up as “the wrong URL” getting the credit. You spot it because the page you care about stays quiet while a sibling URL gets noisy.
- Impressions appear under an unexpected URL variant
- Two duplicates split queries and clicks
- The “wrong” page ranks for your target terms
- Performance changes without on-page changes
- Page reports show inconsistent indexing statuses
Treat the noisy URL as your lead, not a distraction.
Inspect to confirm
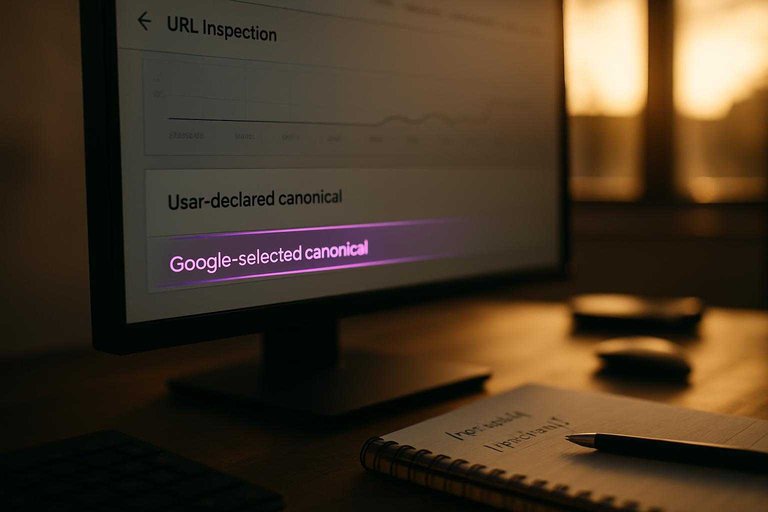
URL Inspection tells you what you declared and what Google accepted. You need both canonicals side by side.
- Inspect the target URL and open “Page indexing.”
- Compare “User-declared canonical” vs “Google-selected canonical.”
- Repeat inspection on the Google-selected canonical URL.
- Check “Referring page” and “Discovery” signals for each URL.
- Review indexing status differences and any duplicates noted.
If Google-selected differs, your reports are telling the truth, just for another URL.
Fix canonical signals
Fixes work when every signal points the same way. Mixed messages keep Google free to choose.
- Set a single canonical URL and ensure each duplicate points to it.
- Update internal links to use the canonical URL everywhere.
- List only canonicals in XML sitemaps, not alternates.
- Use redirects for true duplicates you never want indexed.
- Remove conflicting canonicals, mixed trailing slashes, and parameter traps.
Decide what the canonical is, then make your whole site agree.
Mistake 5: Indexing Isn’t Happening
Performance data only appears for URLs Google can index and serve. If indexing fails, your “missing” clicks and impressions never had a chance to exist.
Treat Performance as the scoreboard. Indexing is eligibility to play.
Eligibility checklist
Index eligibility fails for boring, fixable reasons. Check these before you assume GSC is “wrong.” If you need a process to keep these basics from slipping, use this checklist for streamlining SEO content.
- robots.txt blocks the URL or critical assets
- meta robots or x-robots-tag set to noindex
- auth walls, geo blocks, or gated content
- soft 404s or “thin” error pages
- blocked JS/CSS breaks rendering and signals low value
If you see one blocker, fix it. If you see three, it’s systemic.
Coverage vs performance
A URL can show up in Pages/Indexing reports without earning impressions. That’s normal when Google knows the URL but doesn’t choose to show it.
Imagine a tag page discovered via internal links. It may be crawled, even indexed, yet get zero impressions because demand is low or it’s redundant.
The tell is intent. No impressions is fine when nobody searches for it, not when it’s a core landing page.
Fix indexing blockers
Start with the blockers that prevent eligibility at all. Then tighten signals so Google keeps it indexed.
- Remove noindex and unblock robots.txt for the target URL and key resources.
- Fix server responses so important pages return a clean 200.
- Update and resubmit your sitemap with canonical, indexable URLs only.
- Request indexing for the few URLs that actually matter.
Indexing fixes are leverage. Once eligibility is back, Performance data becomes debuggable again.
Run the 10‑Minute GSC Data Recovery Check
- Confirm scope: switch between Domain vs URL-prefix properties and verify the exact protocol/subdomain matches your site.
- Clear the view: remove all Performance report filters (query/page/country/device/search appearance) and re-check totals.
- Use safe dates: look at the last 28 days (excluding the most recent 1–2 days), then compare to the previous 28 days—avoid single-day comparisons.
- Validate attribution: inspect a missing URL to confirm Google-selected canonical and whether the URL is indexed.
- Fix the root cause: correct property coverage, canonical signals, or indexing blockers—then re-check Performance after recrawl and processing.
Frequently Asked Questions
- Why is google webmaster console showing “No data” even though Google Analytics has traffic?
- Google Analytics tracks visits after users land on your site, while google webmaster console reports Google Search impressions/clicks only for indexed URLs and supported surfaces. Check the Performance report is set to “Web,” you’re viewing the right property, and the date range isn’t excluding recent days.
- How do I check if my Performance report is missing queries because of privacy thresholds in Google Search Console?
- You can’t turn thresholds off, but you can look for signs like lower total query counts, missing long-tail queries, or totals that don’t match exported detail rows. Validate by comparing page-level data, using broader filters (country/device), and exporting at different granularities (queries vs pages).
- How do I confirm Google is indexing my page but not showing it in google webmaster console performance data?
- Use the URL Inspection tool to verify “URL is on Google” and that the inspected URL matches the canonical Google chose. If it’s indexed but still has no impressions, confirm the query/page can realistically rank and that you’re not looking at a different property, search type, or filtered view.
- Should I add both Domain and URL-prefix properties in google webmaster console?
- Yes, most sites benefit from both: a Domain property for complete coverage across subdomains/protocols and URL-prefix properties for URL-level verification and clearer segmentation. Add all key variants (www/non-www, http/https, important subdomains) so you can quickly isolate where data is appearing.
- What’s the best way to monitor google webmaster console data alongside ongoing content publishing?
- Set up a routine that tracks clicks/impressions by page groups (templates, categories) and reviews indexing/coverage changes after each release. If you publish at high volume, a platform like Skribra can help keep output consistent while you verify new URLs get indexed and start earning impressions in Search Console.
Turn Clean Data Into Growth
Once you fix property setup, filters, date ranges, canonicals, and indexing, the real work is acting on what Search Console is finally showing you.
Skribra turns those insights into consistent, SEO-optimized publishing with WordPress integration, meta-ready formatting, and built-in backlinks—plus a 3-Day Free Trial to get started.
Written by
Skribra
This article was crafted with AI-powered content generation. Skribra creates SEO-optimized articles that rank.
Share: